Q4 & FY 2018 Financial Results
Q4 & Full Year 2018 Highlights
■
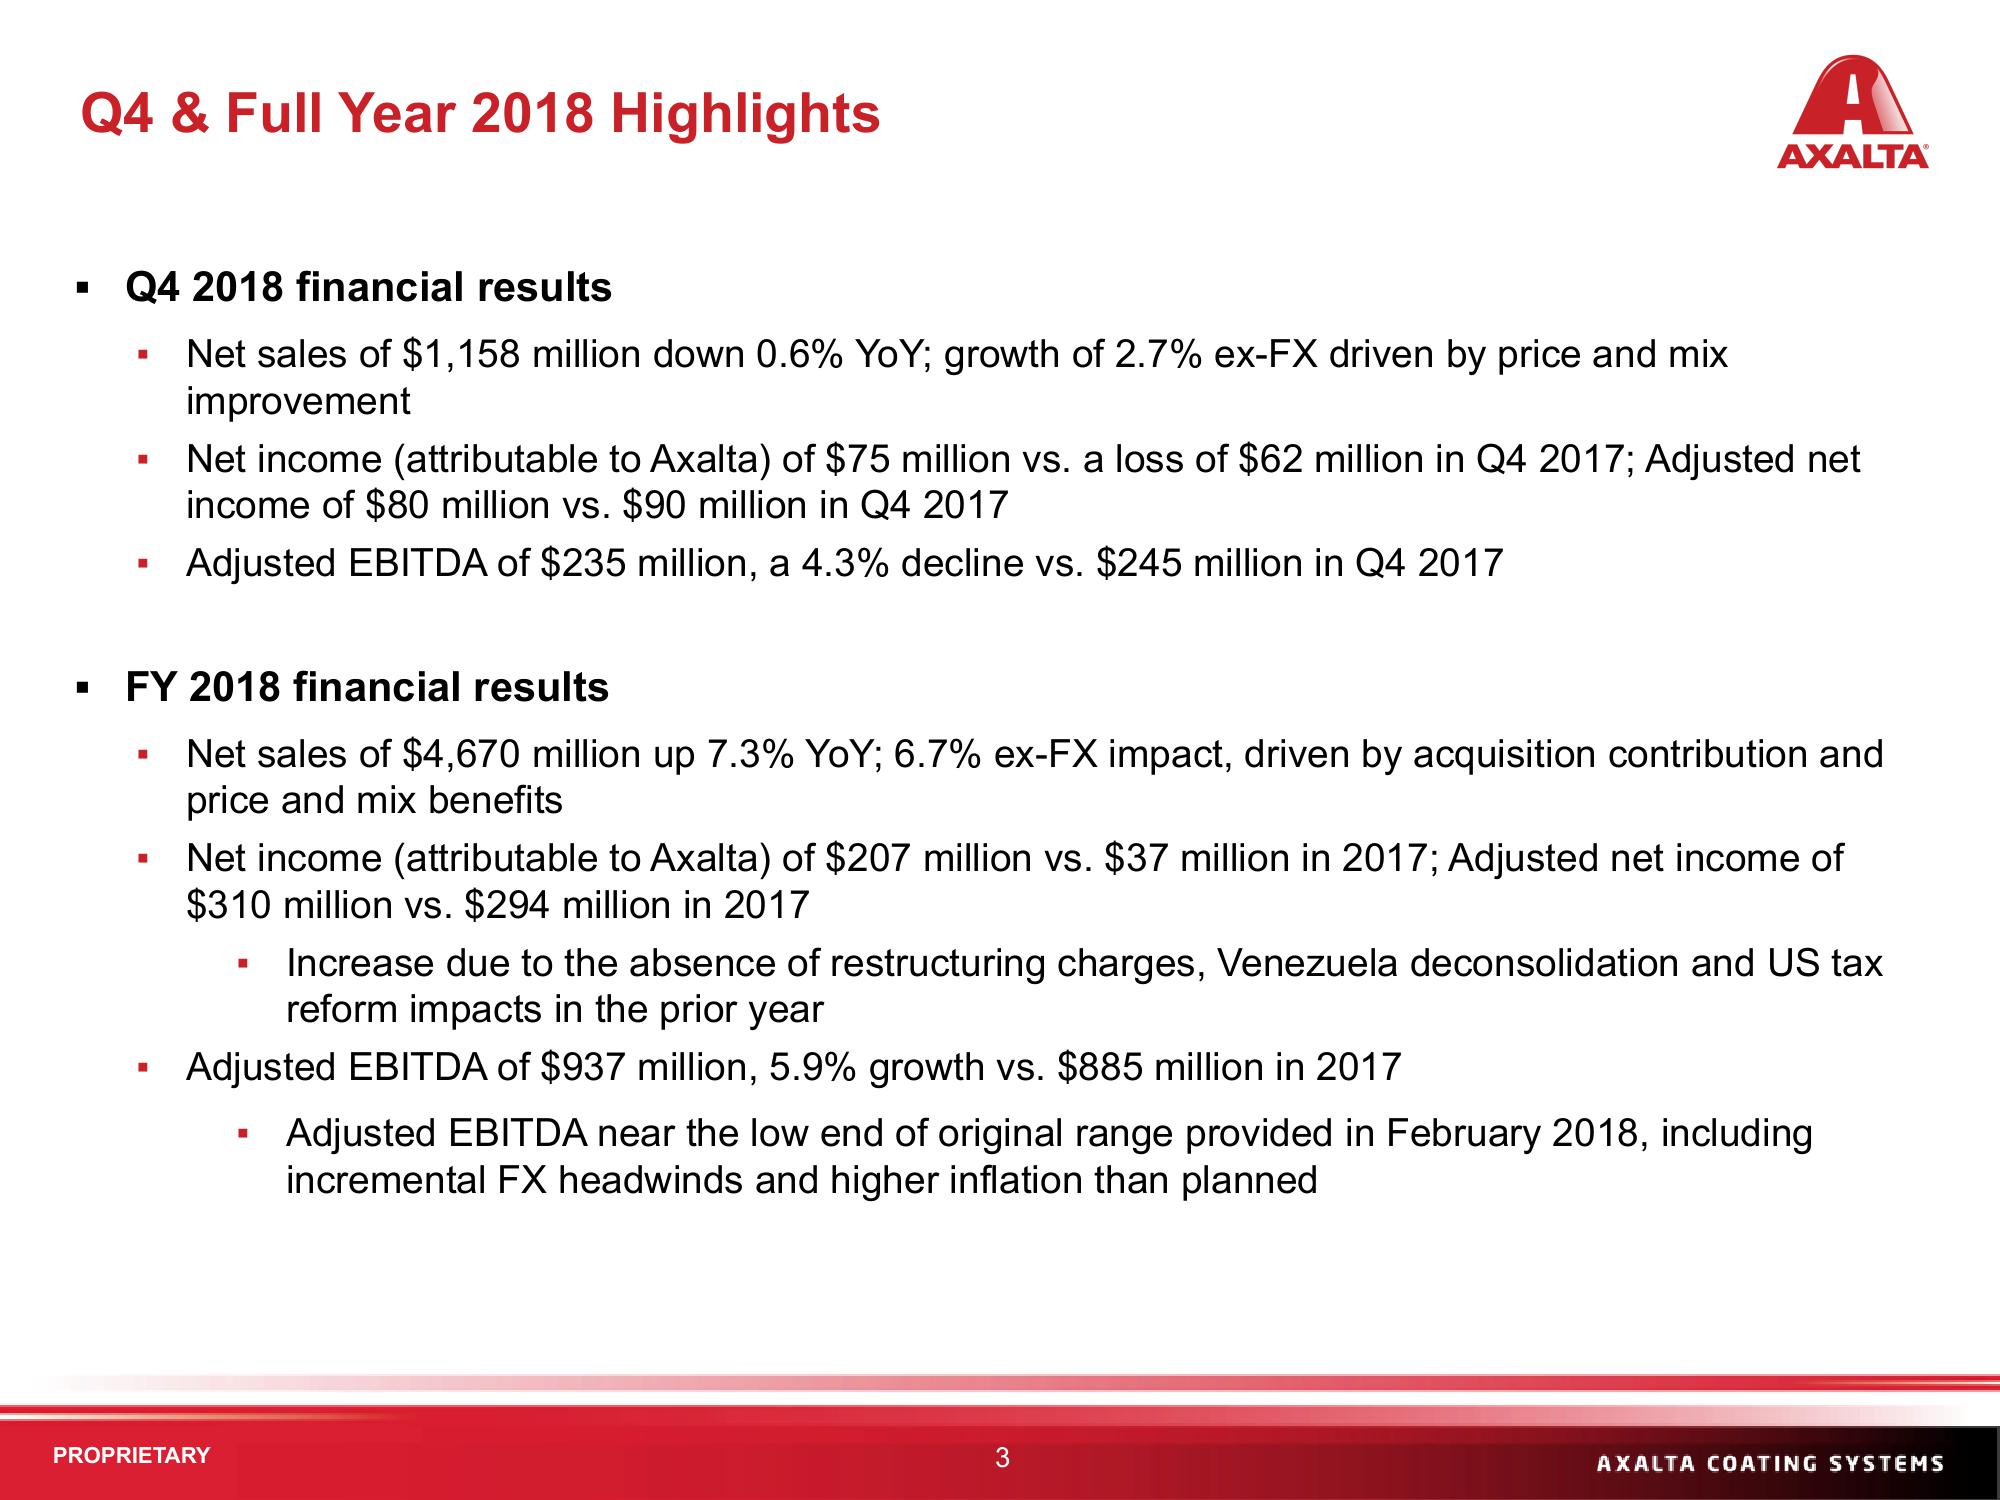
Q4 2018 financial results
Net sales of $1,158 million down 0.6% YoY; growth of 2.7% ex-FX driven by price and mix
improvement
■
■
■
■
FY 2018 financial results
Net sales of $4,670 million up 7.3% YoY; 6.7% ex-FX impact, driven by acquisition contribution and
price and mix benefits
■
■
Net income (attributable to Axalta) of $75 million vs. a loss of $62 million in Q4 2017; Adjusted net
income of $80 million vs. $90 million in Q4 2017
Adjusted EBITDA of $235 million, a 4.3% decline vs. $245 million in Q4 2017
Net income (attributable to Axalta) of $207 million vs. $37 million in 2017; Adjusted net income of
$310 million vs. $294 million in 2017
A
AXALTAⓇ
Increase due to the absence of restructuring charges, Venezuela deconsolidation and US tax
reform impacts in the prior year
Adjusted EBITDA of $937 million, 5.9% growth vs. $885 million in 2017
PROPRIETARY
I
■
Adjusted EBITDA near the low end of original range provided in February 2018, including
incremental FX headwinds and higher inflation than planned
3
AXALTA COATING SYSTEMSView entire presentation