Altus Power Results Presentation Deck
Statement of
Operations
box
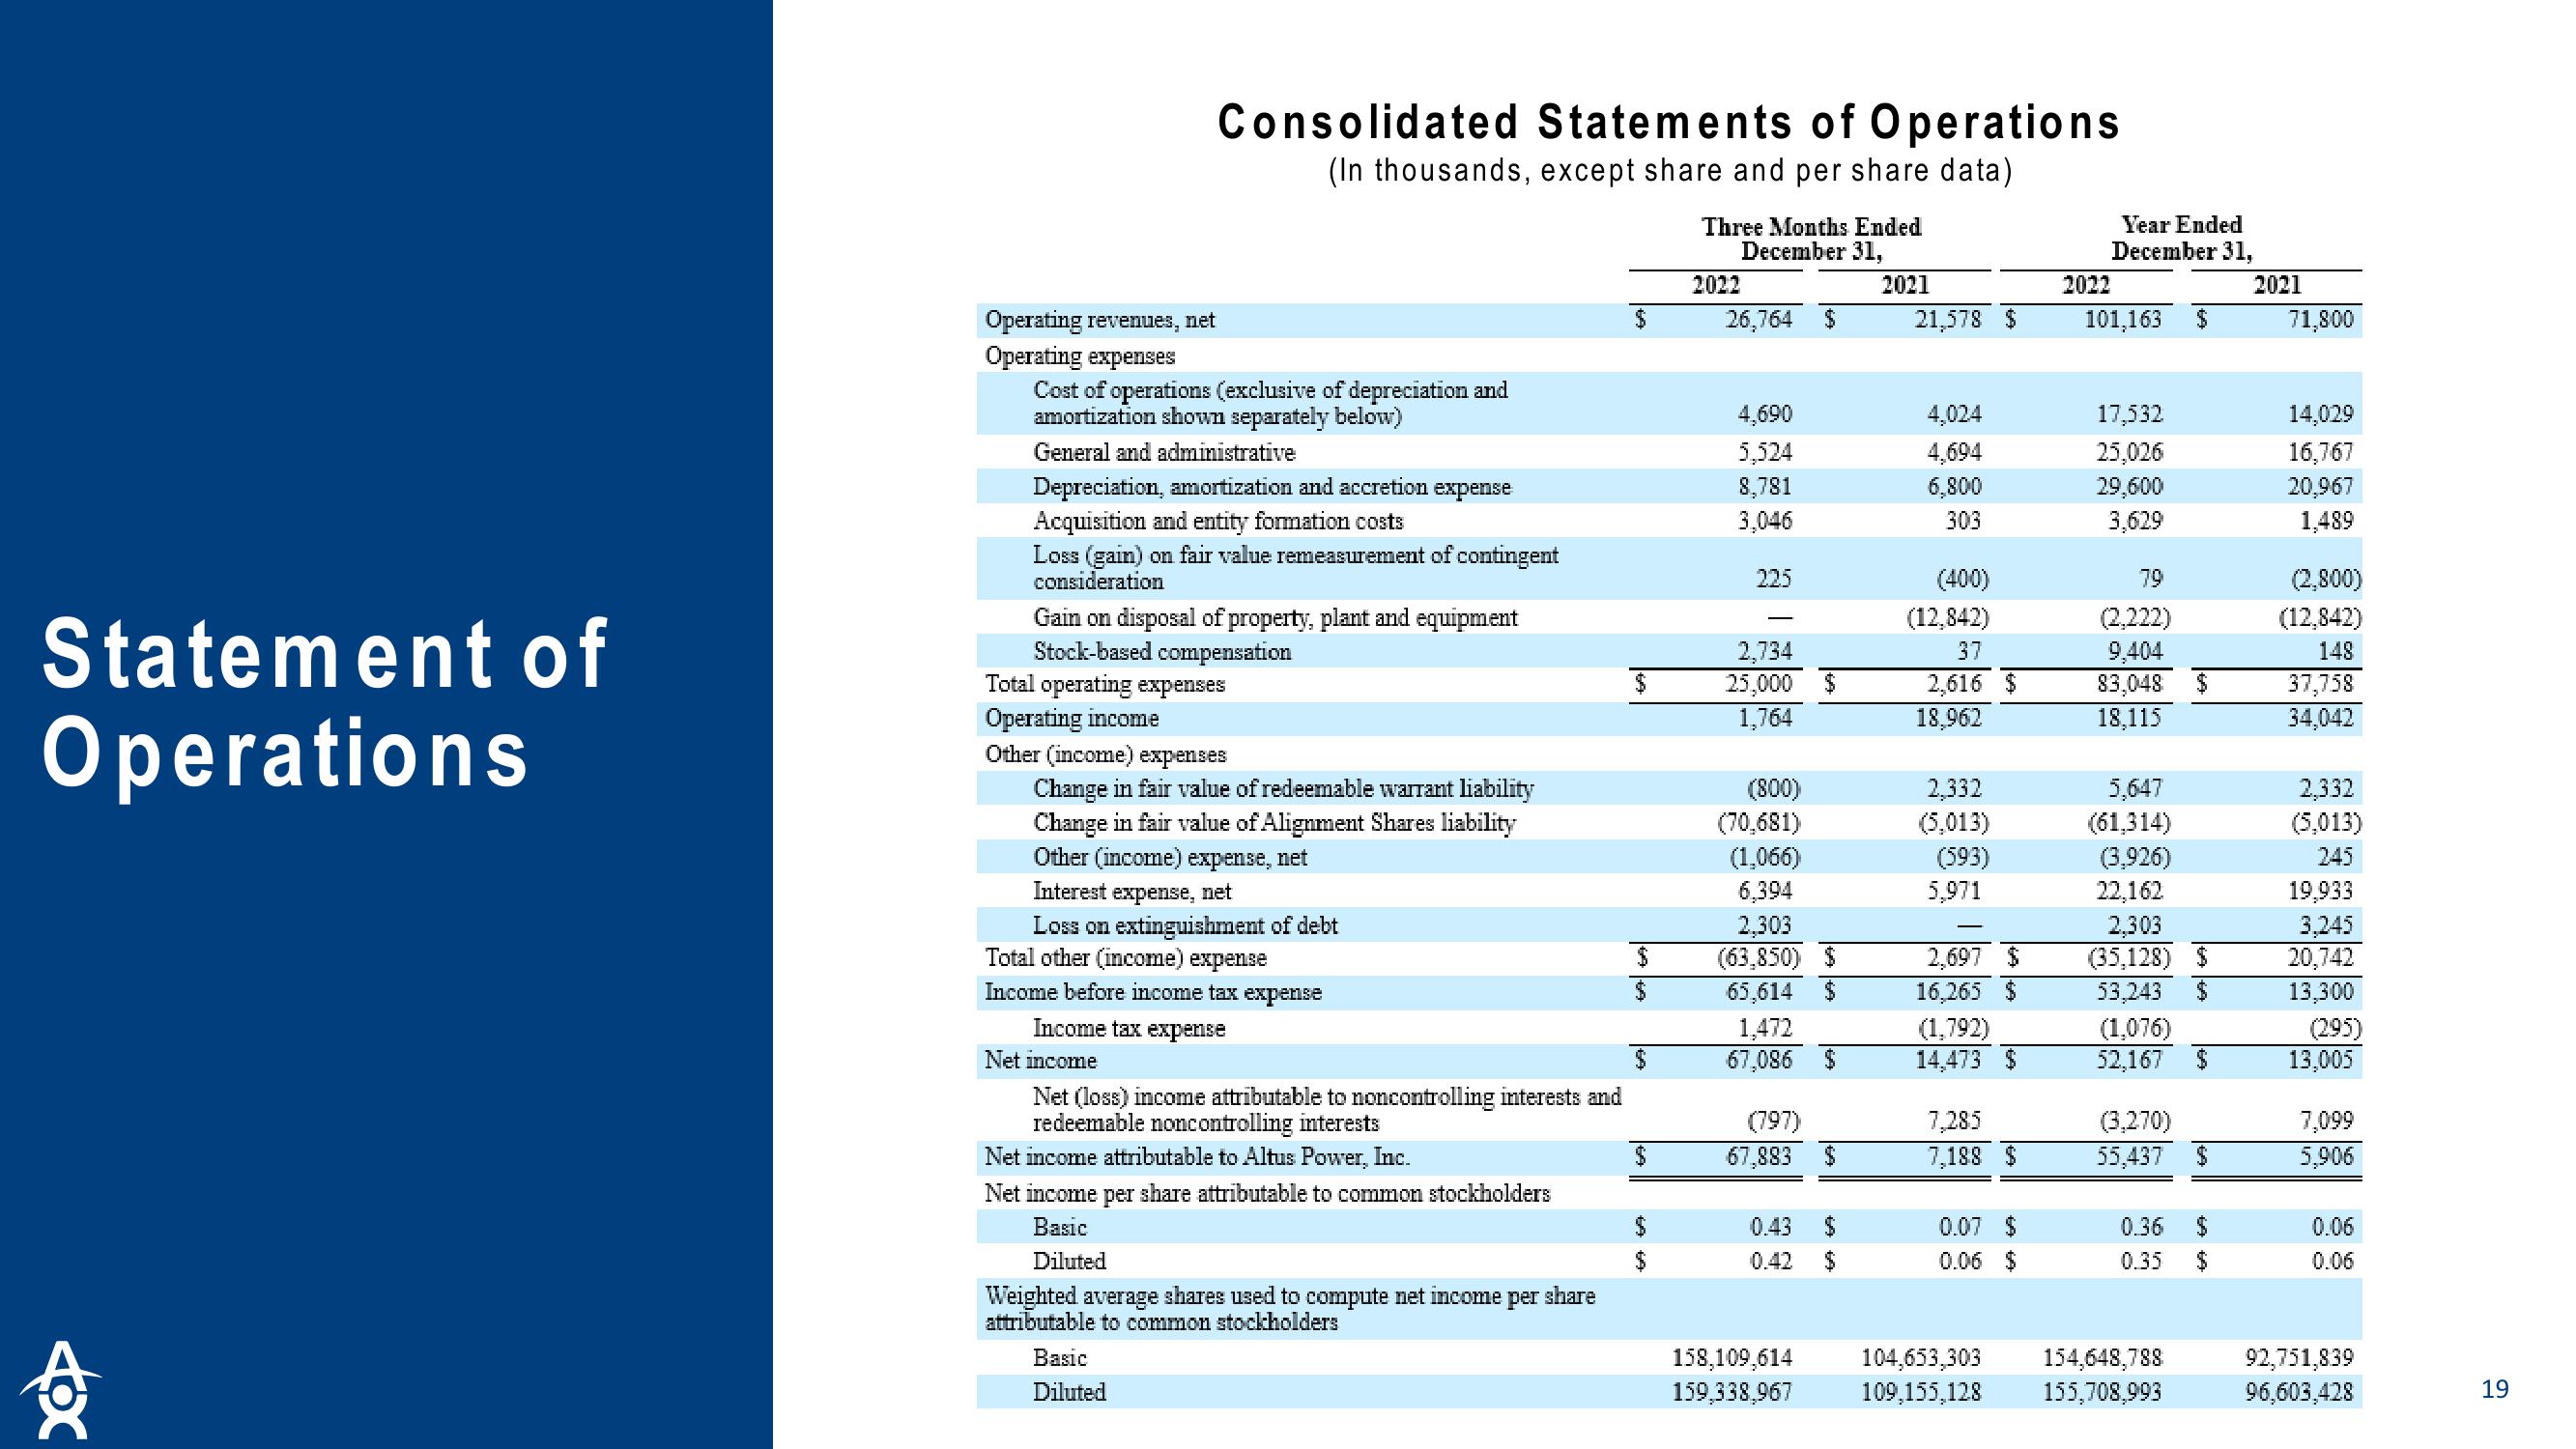
Consolidated Statements of Operations
(In thousands, except share and per share data)
Operating revenues, net
Operating expenses
Cost of operations (exclusive of depreciation and
amortization shown separately below)
General and administrative
Depreciation, amortization and accretion expense
Acquisition and entity formation costs
Loss (gain) on fair value remeasurement of contingent
consideration
Gain on disposal of property, plant and equipment
Stock-based compensation
Total operating expenses
Operating income
Other (income) expenses
Change in fair value of redeemable warrant liability
Change in fair value of Alignment Shares liability
Other (income) expense, net
Interest expense, net
Loss on extinguishment of debt
Total other (income) expense
Income before income tax expense
Income tax expense
Net income
Net (loss) income attributable to noncontrolling interests and
redeemable noncontrolling interests
Net income attributable to Altus Power, Inc.
Net income per share attributable to common stockholders
Basic
Diluted
Weighted average shares used to compute net income per share
attributable to common stockholders
Basic
Diluted
$
$
$
$
Three Months Ended
December 31,
2021
2022
26,764 $
4,690
5,524
8,781
3,046
225
-
2,734
25,000 $
1,764
(800)
(70,681)
(1,066)
6,394
2,303
(63,850) $
65,614 $
1,472
67,086 $
(797)
67,883 $
0.43
0.42
158,109,614
159,338,967
$
21,578 $
4,024
4,694
6,800
303
(400)
(12,842)
37
2,616 $
18,962
2,332
(5,013)
(593)
5,971
2,697 $
16,265 $
(1,792)
14,473 $
7,285
7,188 $
0.07 $
0.06 $
Year Ended
December 31,
2021
2022
101,163 $
17,532
25,026
29,600
3,629
79
(2,222)
9,404
83,048 $
18,115
5,647
(61,314)
(3,926)
22,162
2,303
(35,128) $
53,243 $
(1,076)
52,167 $
(3,270)
55,437 $
0.36 $
0.35 $
104,653,303 154,648,788
109,155,128 155,708,993
71,800
14,029
16,767
20,967
1,489
(2,800)
(12,842)
148
37,758
34,042
2,332
(5,013)
245
19,933
3,245
20,742
13,300
(295)
13,005
7,099
5,906
0.06
0.06
92,751,839
96,603,428
19View entire presentation