Better Results Presentation Deck
Management with
experience scaling to $100+
billion origination volume...
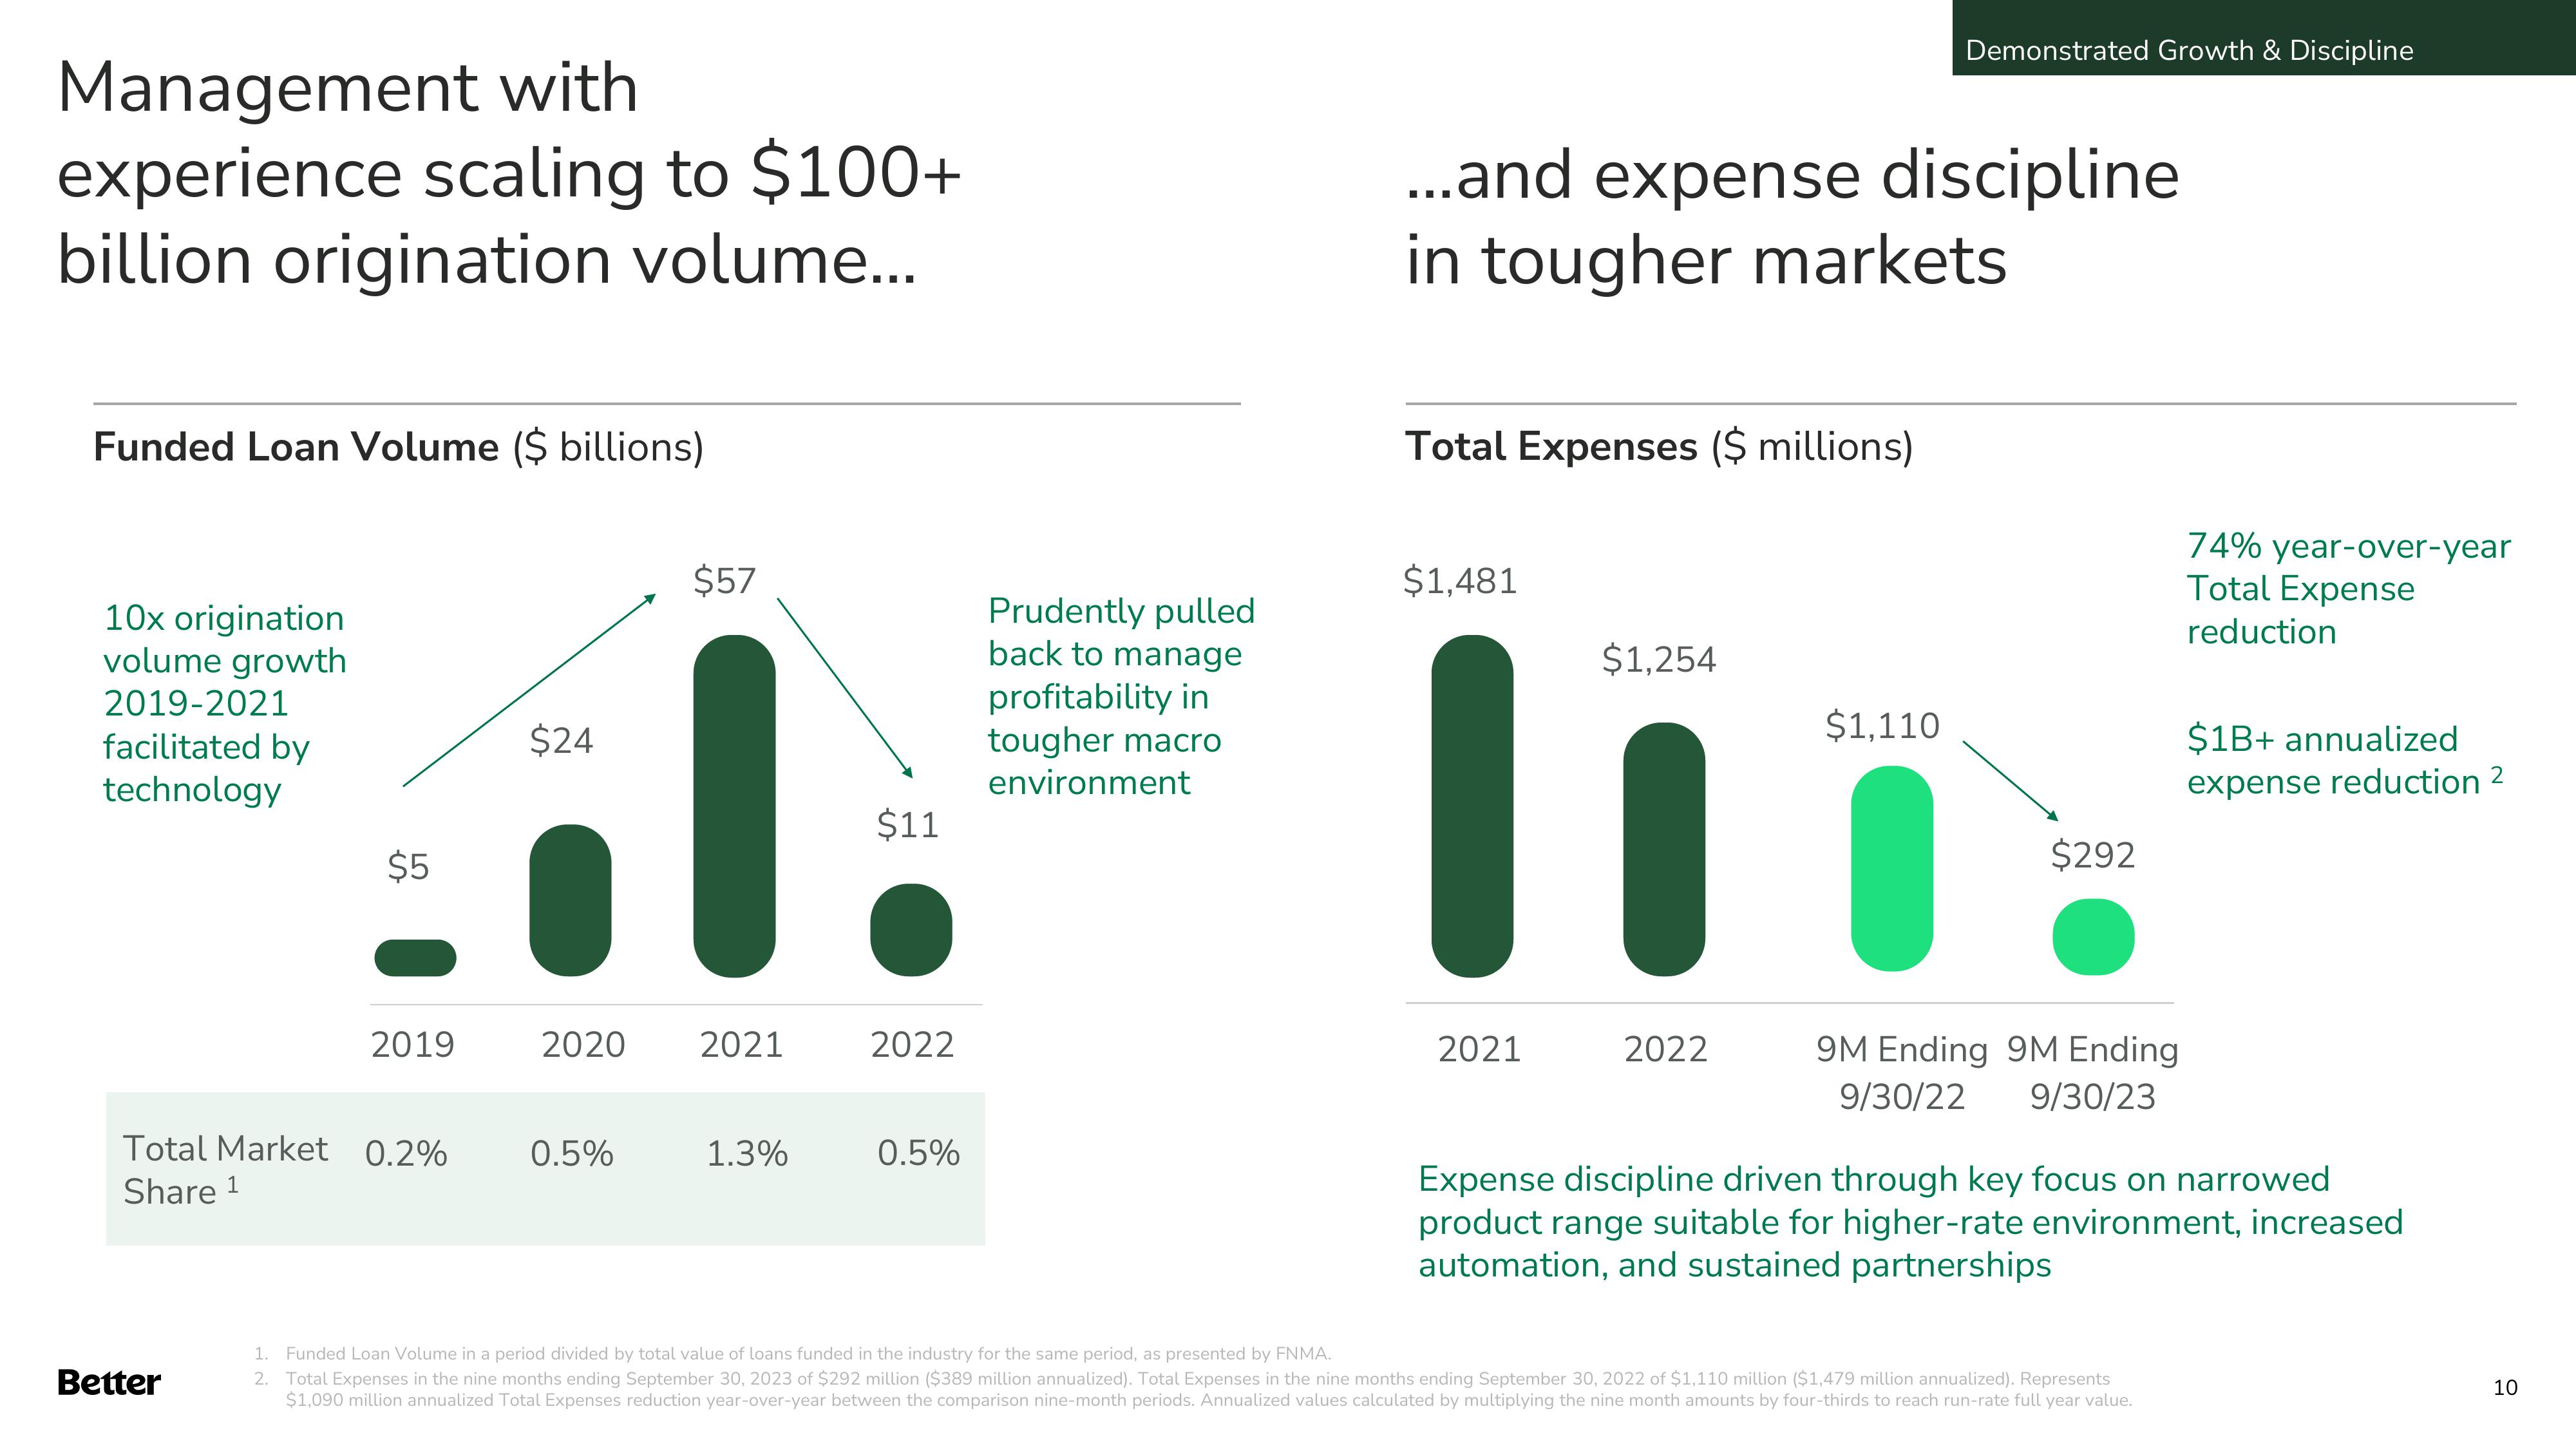
Funded Loan Volume ($ billions)
10x origination
volume growth
2019-2021
facilitated by
technology
$5
Better
2019
Total Market 0.2%
Share ¹
$24
$57
2020 2021
0.5%
1.3%
$11
2022
0.5%
Prudently pulled
back to manage
profitability in
tougher macro
environment
...and expense discipline
in tougher markets
Total Expenses ($ millions)
$1,481
2021
$1,254
2022
Demonstrated Growth & Discipline
$1,110
$292
9M Ending 9M Ending
9/30/22 9/30/23
74% year-over-year
Total Expense
reduction
1. Funded Loan Volume in a period divided by total value of loans funded in the industry for the same period, as presented by FNMA.
2. Total Expenses in the nine months ending September 30, 2023 of $292 million ($389 million annualized). Total Expenses in the nine months ending September 30, 2022 of $1,110 million ($1,479 million annualized). Represents
$1,090 million annualized Total Expenses reduction year-over-year between the comparison nine-month periods. Annualized values calculated by multiplying the nine month amounts by four-thirds to reach run-rate full year value.
$1B+ annualized
expense reduction 2
Expense discipline driven through key focus on narrowed
product range suitable for higher-rate environment, increased
automation, and sustained partnerships
10View entire presentation