Eos Energy Investor Presentation Deck
Path to Profitability
Infrastructure to Support Projected Growth
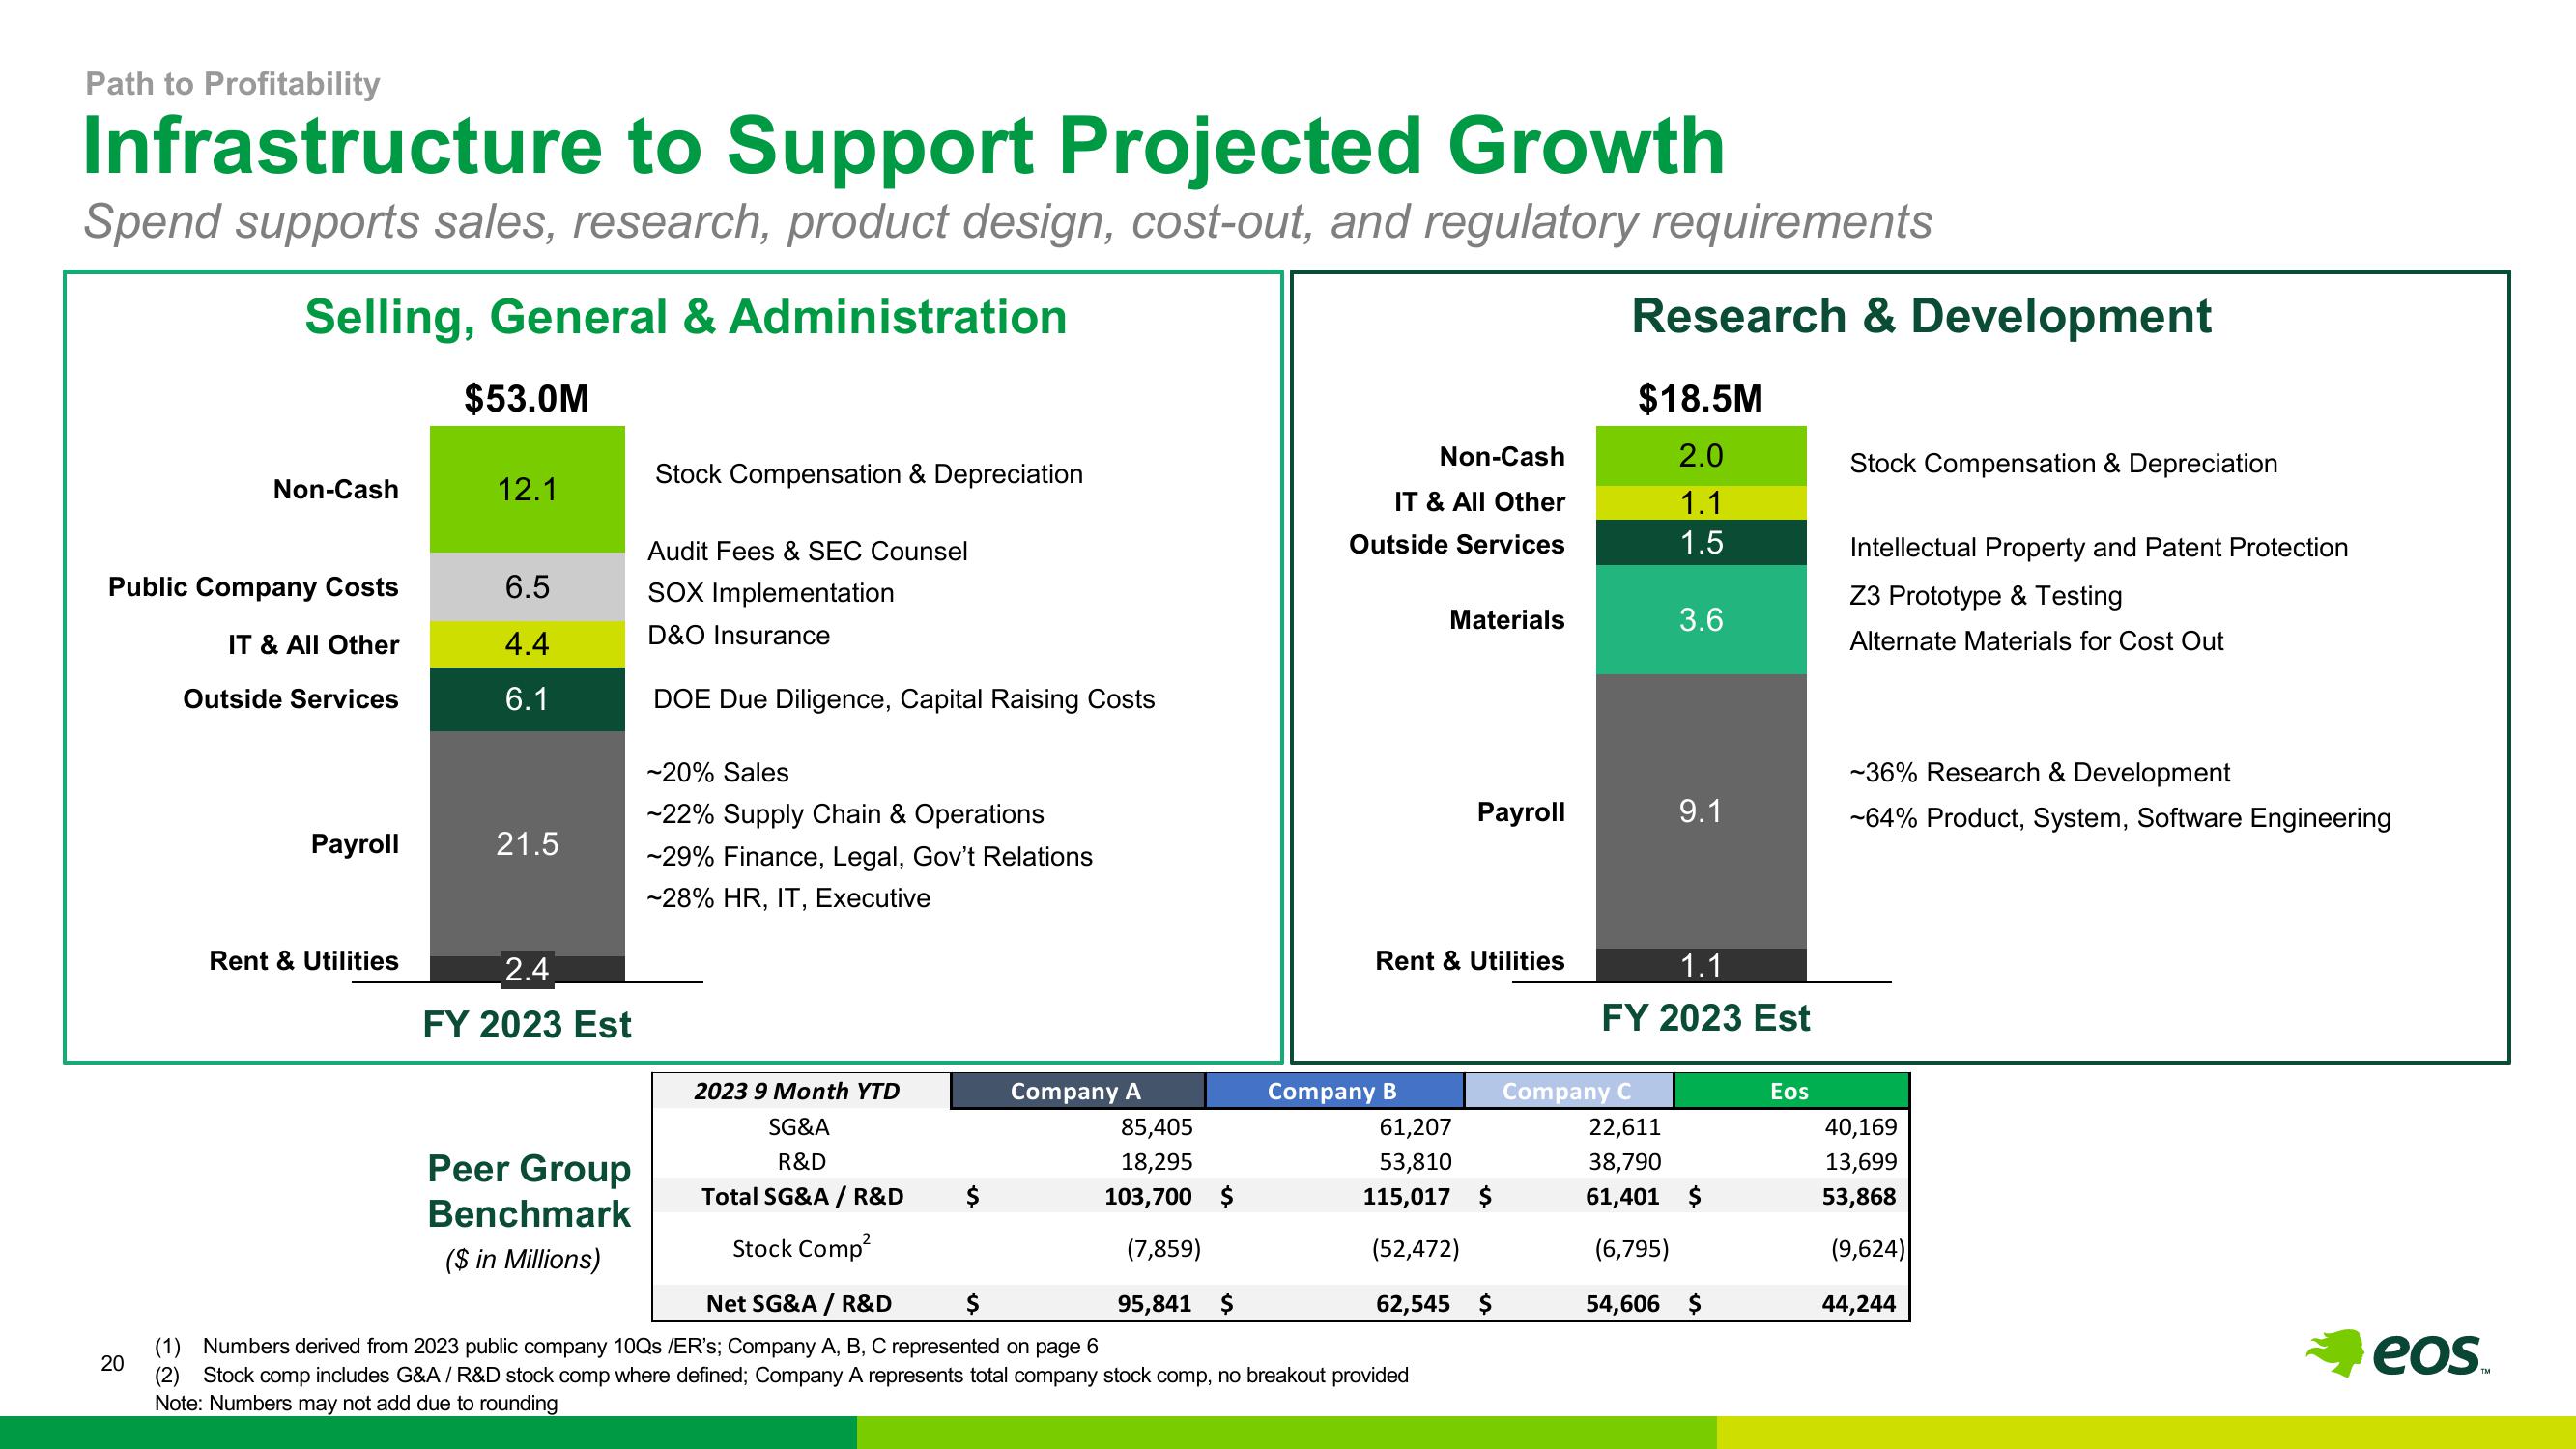
Spend supports sales, research, product design, cost-out, and regulatory requirements
Selling, General & Administration
$53.0M
Non-Cash
Public Company Costs
IT & All Other
Outside Services
20
Payroll
Rent & Utilities
12.1
6.5
4.4
6.1
21.5
2.4
FY 2023 Est
Peer Group
Benchmark
($ in Millions)
Stock Compensation & Depreciation
Audit Fees & SEC Counsel
SOX Implementation
D&O Insurance
DOE Due Diligence, Capital Raising Costs
~20% Sales
~22% Supply Chain & Operations
-29% Finance, Legal, Gov't Relations
~28% HR, IT, Executive
2023 9 Month YTD
SG&A
R&D
Total SG&A / R&D
Stock Comp²
Company A
85,405
18,295
103,700 $
(7,859)
95,841 $
Non-Cash
IT & All Other
Outside Services
Company B
Materials
Rent & Utilities
Payroll
Net SG&A / R&D
$
(1) Numbers derived from 2023 public company 10Qs /ER's; Company A, B, C represented on page 6
(2) Stock comp includes G&A / R&D stock comp where defined; Company A represents total company stock comp, no breakout provided
Note: Numbers may not add due to rounding
61,207
53,810
115,017 $
(52,472)
62,545 $
Research & Development
$18.5M
2.0
1.1
1.5
Company C
3.6
9.1
1.1
FY 2023 Est
22,611
38,790
61,401 $
(6,795)
54,606 $
Eos
Stock Compensation & Depreciation
Intellectual Property and Patent Protection
Z3 Prototype & Testing
Alternate Materials for Cost Out
-36% Research & Development
-64% Product, System, Software Engineering
40,169
13,699
53,868
(9,624)
44,244
eos.View entire presentation