Bank of America Results Presentation Deck
Global Markets¹
Summary Income Statement ($MM)
Total revenue, net of interest expense²
Net DVA
Total revenue (excl. net DVA)2.3
Provision (benefit) for credit losses
Noninterest expense
Pretax income
Pretax, pre-provision income4
Income tax expense
Net income
Net income (excl. net DVA)³
Selected Revenue Items ($MM)²
Sales and trading revenue
Sales and trading revenue (excl. net DVA)³
FICC (excl. net DVA)³
Equities (excl. net DVA)³
Global Markets IB fees
Key Indicators ($B)
Average total assets
Average trading-related assets
Average 99% VaR ($MM)?
Average loans and leases
Net charge-offs ($MM)
Reserve build (release) ($MM)
Return on average allocated capital
Allocated capital
Efficiency ratio
3Q22
$4,483
(14)
4,497
11
3,023
1,449
1,460
384
$1,065
$1,076
3Q22
$4,092
4,106
2,567
1,539
430
3Q22
$847.9
592.4
117
120.4
(1)
12
10 %
$42.5
Inc / (Dec)
For more information on the liquidating business realignment, see note F on slide 32.
See note G on slide 32 for the definition of VaR.
2Q22
($19)
(172)
153
3
(86)
64
67
17
$47
$178
2Q22
$4,153
3,995
2,340
1,655
461
2Q22
$866.7
606.1
118
114.4
(4)
12
10 %
$42.5
3Q21
($36)
6
(42)
(5)
(229)
198
193
59
$139
$135
3Q21
$3,614
3,634
2,025
1,609
844
3Q21
$804.9
563.7
78
97.1
16
10 %
$38.0
.
.
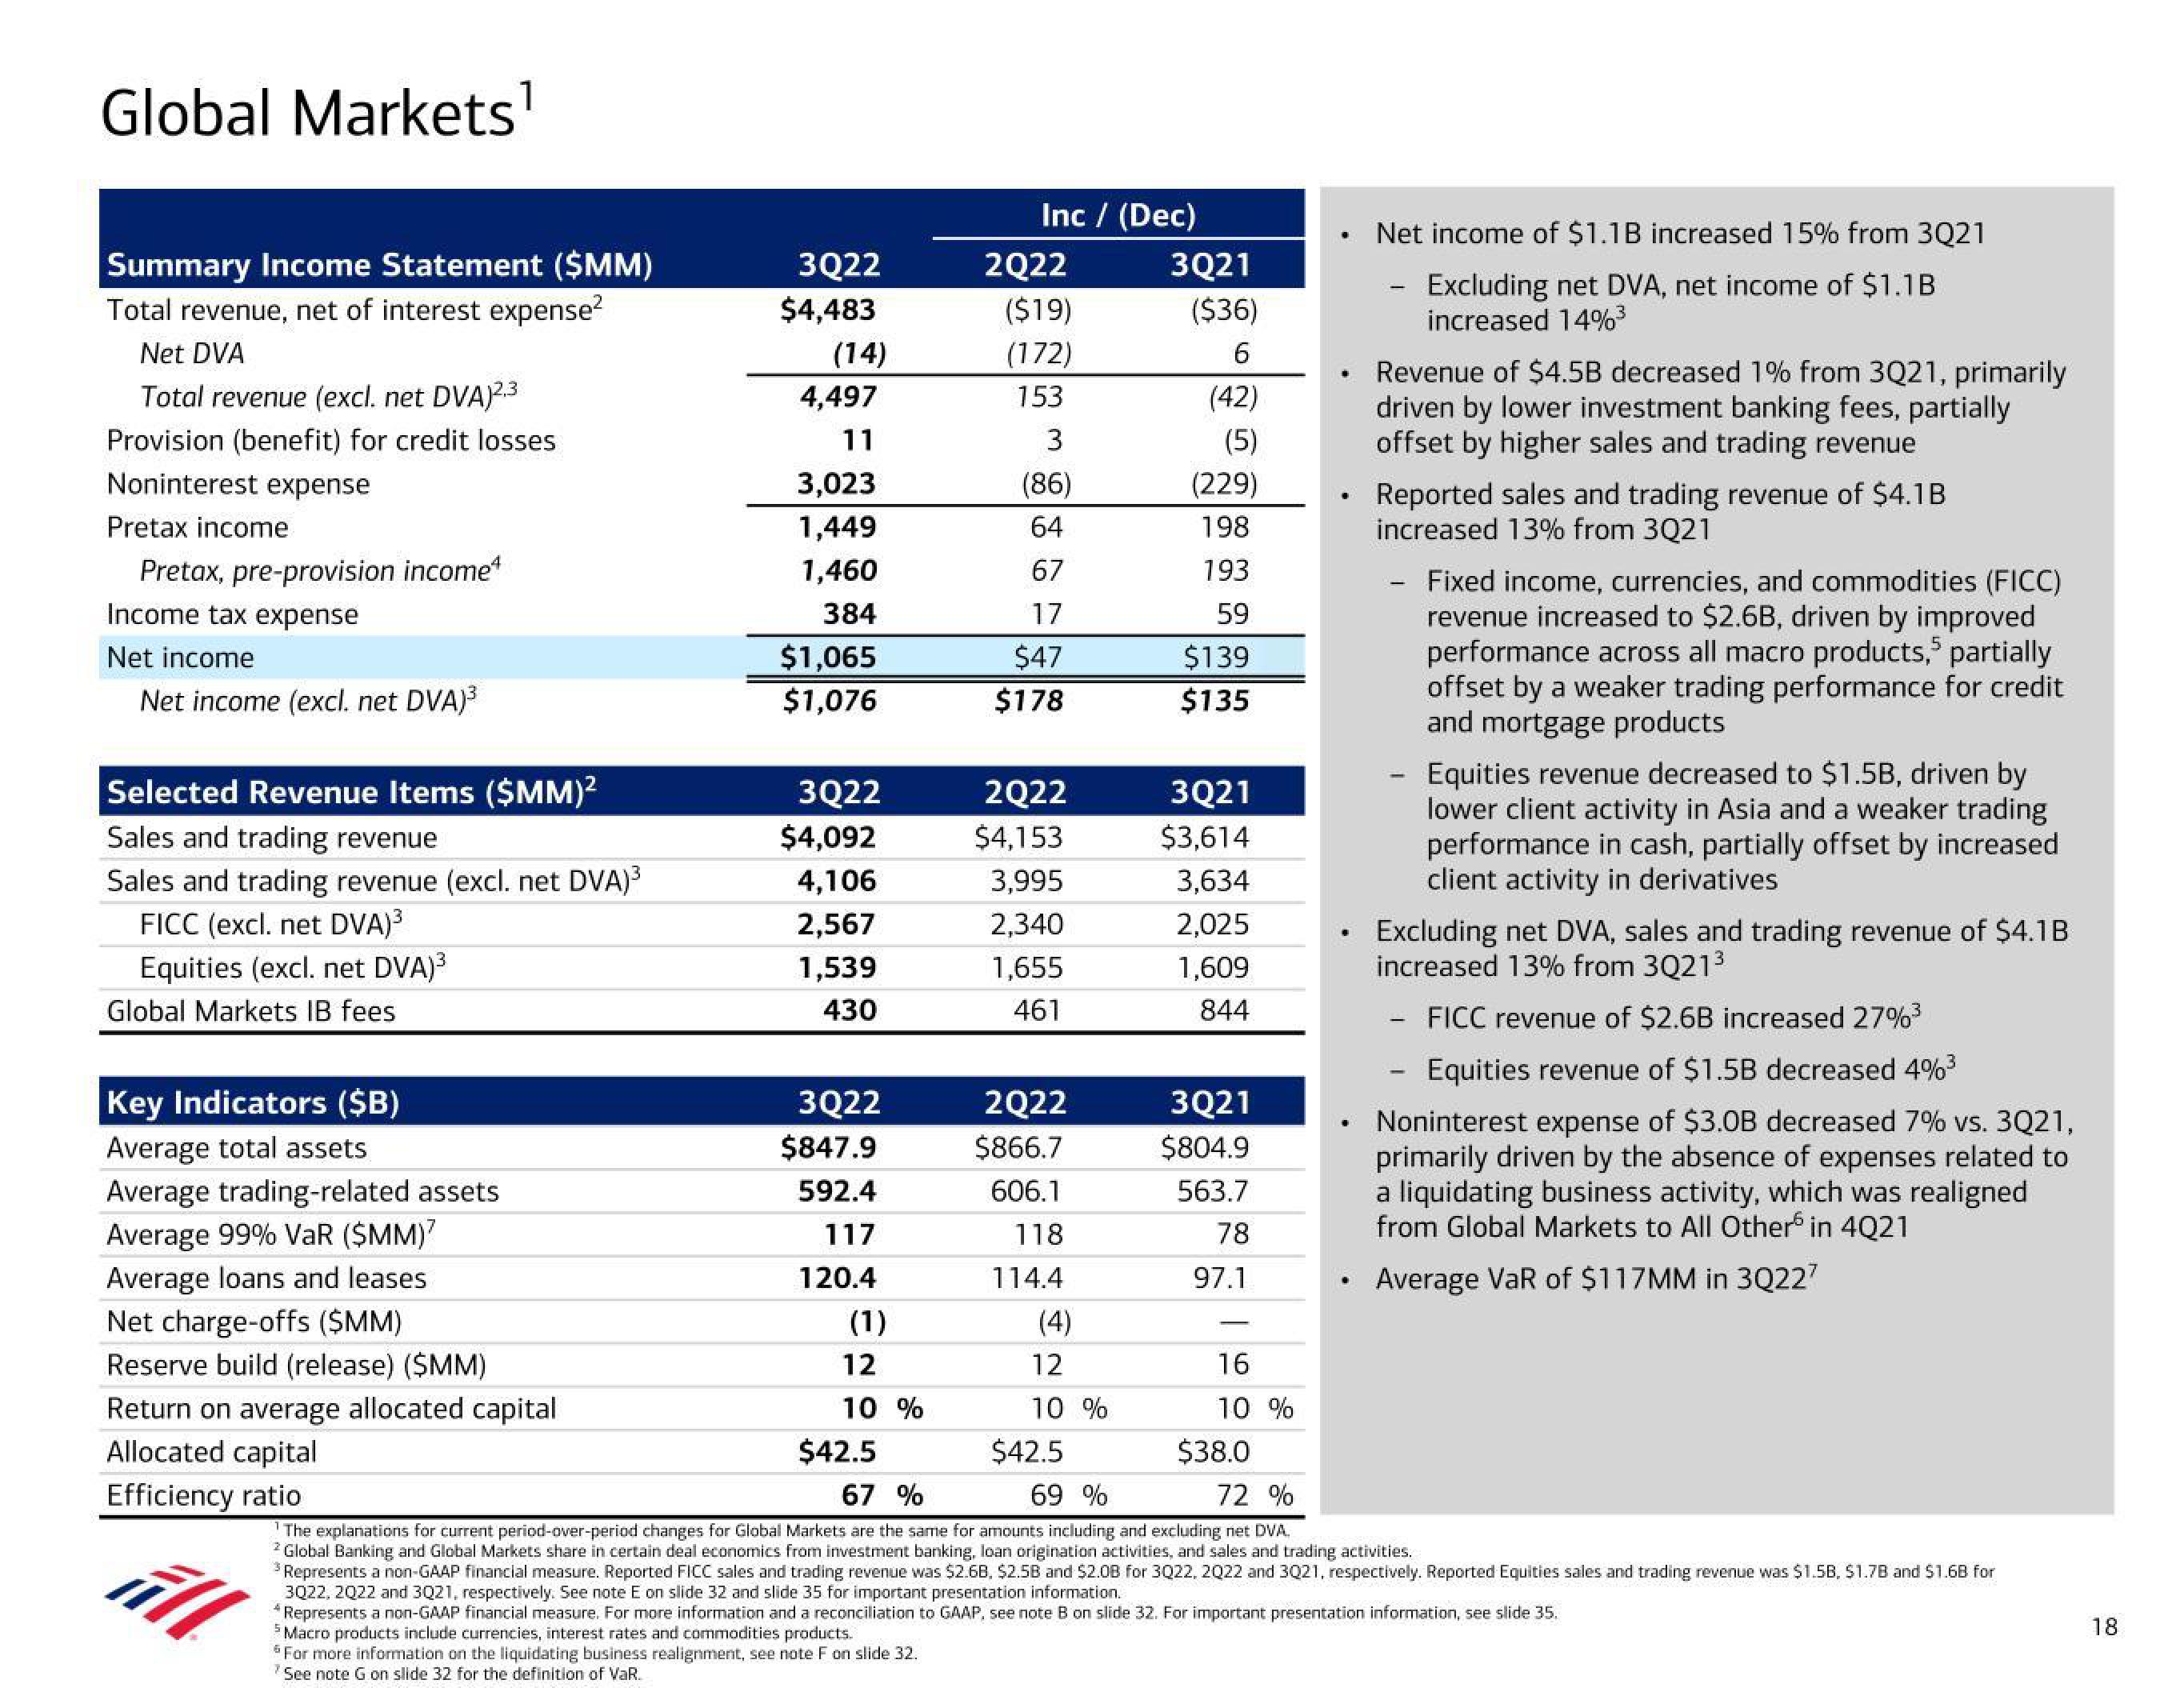
Net income of $1.1B increased 15% from 3Q21
Excluding net DVA, net income of $1.1B
increased 14%³
Revenue of $4.5B decreased 1% from 3Q21, primarily
driven by lower investment banking fees, partially
offset by higher sales and trading revenue
Reported sales and trading revenue of $4.1B
increased 13% from 3Q21
Fixed income, currencies, and commodities (FICC)
revenue increased to $2.6B, driven by improved
performance across all macro products,5 partially
offset by a weaker trading performance for credit
and mortgage products
Equities revenue decreased to $1.5B, driven by
lower client activity in Asia and a weaker trading
performance in cash, partially offset by increased
client activity in derivatives
Excluding net DVA, sales and trading revenue of $4.1B
increased 13% from 3Q21³
FICC revenue of $2.6B increased 27%³
Equities revenue of $1.5B decreased 4%³
Noninterest expense of $3.0B decreased 7% vs. 3Q21,
primarily driven by the absence of expenses related to
a liquidating business activity, which was realigned
from Global Markets to All Other in 4Q21
Average VaR of $117MM in 3Q227
67 %
69 %
72 %
The explanations for current period-over-period changes for Global Markets are the same for amounts including and excluding net DVA.
2 Global Banking and Global Markets share in certain deal economics from investment banking, loan origination activities, and sales and trading activities.
³ Represents a non-GAAP financial measure. Reported FICC sales and trading revenue was $2.68, $2.5B and $2.0B for 3Q22, 2022 and 3Q21, respectively. Reported Equities sales and trading revenue was $1.5B, $1.7B and $1.6B for
3Q22, 2022 and 3Q21, respectively. See note E on slide 32 and slide 35 for important presentation information.
*Represents a non-GAAP financial measure. For more information and a reconciliation to GAAP, see note B on slide 32. For important presentation information, see slide 35.
5 Macro products include currencies, interest rates and commodities products.
18View entire presentation