LSE Mergers and Acquisitions Presentation Deck
Growth opportunities in each of the
combined company's key segments
Data &
Analytics (3)
Capital
Markets
Post Trade
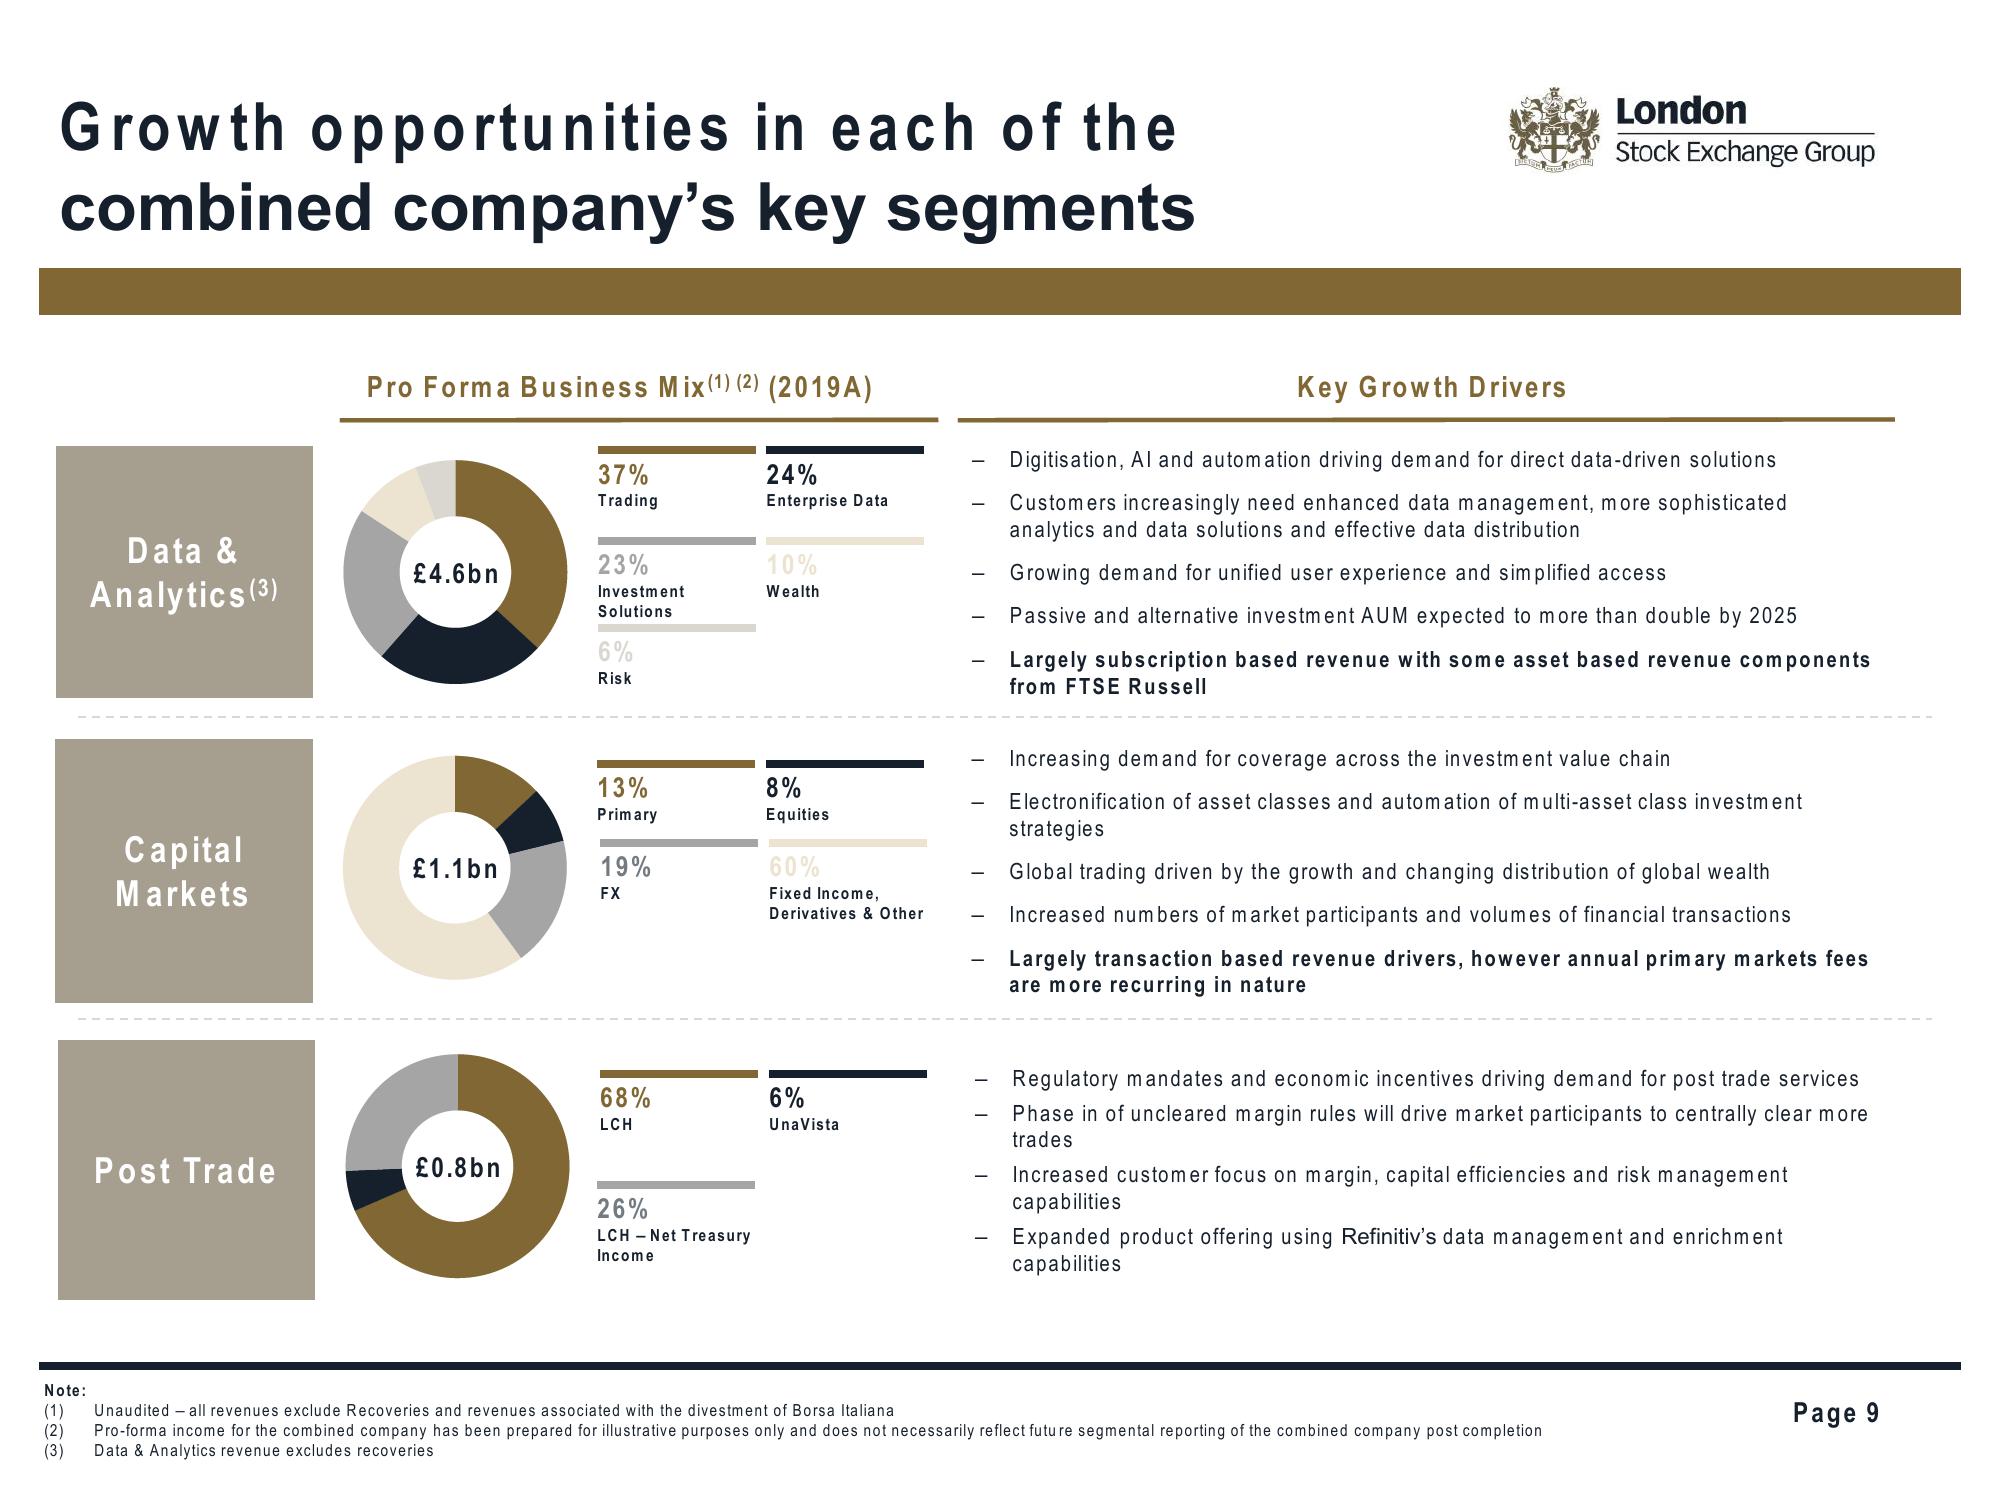
Pro Forma Business Mix (¹) (2) (2019A)
£4.6bn
£1.1bn
£0.8bn
37%
Trading
23%
Investment
Solutions
6%
Risk
13%
Primary
19%
FX
68%
LCH
26%
LCH-Net Treasury
Income
24%
Enterprise Data
10%
Wealth
8%
Equities
60%
Fixed Income,
Derivatives & Other
6%
UnaVista
Key Growth Drivers
London
Stock Exchange Group
Digitisation, Al and automation driving demand for direct data-driven solutions
Customers increasingly need enhanced data management, more sophisticated
analytics and data solutions and effective data distribution
Growing demand for unified user experience and simplified access
Passive and alternative investment AUM expected to more than double by 2025
Largely subscription based revenue with some asset based revenue components
from FTSE Russell
Increasing demand for coverage across the investment value chain
Electronification of asset classes and automation of multi-asset class investment
strategies
Global trading driven by the growth and changing distribution of global wealth
Increased numbers of market participants and volumes of financial transactions
Largely transaction based revenue drivers, however annual primary markets fees
are more recurring in nature
Regulatory mandates and economic incentives driving demand for post trade services
Phase in of uncleared margin rules will drive market participants to centrally clear more
trades
Increased customer focus on margin, capital efficiencies and risk management
capabilities
Expanded product offering using Refinitiv's data management and enrichment
capabilities
Note:
(1) Unaudited all revenues exclude Recoveries and revenues associated with the divestment of Borsa Italiana.
(2)
Pro-forma income for the combined company has been prepared for illustrative purposes only and does not necessarily reflect future segmental reporting of the combined company post completion
(3) Data & Analytics revenue excludes recoveries
PageView entire presentation