REE SPAC Presentation Deck
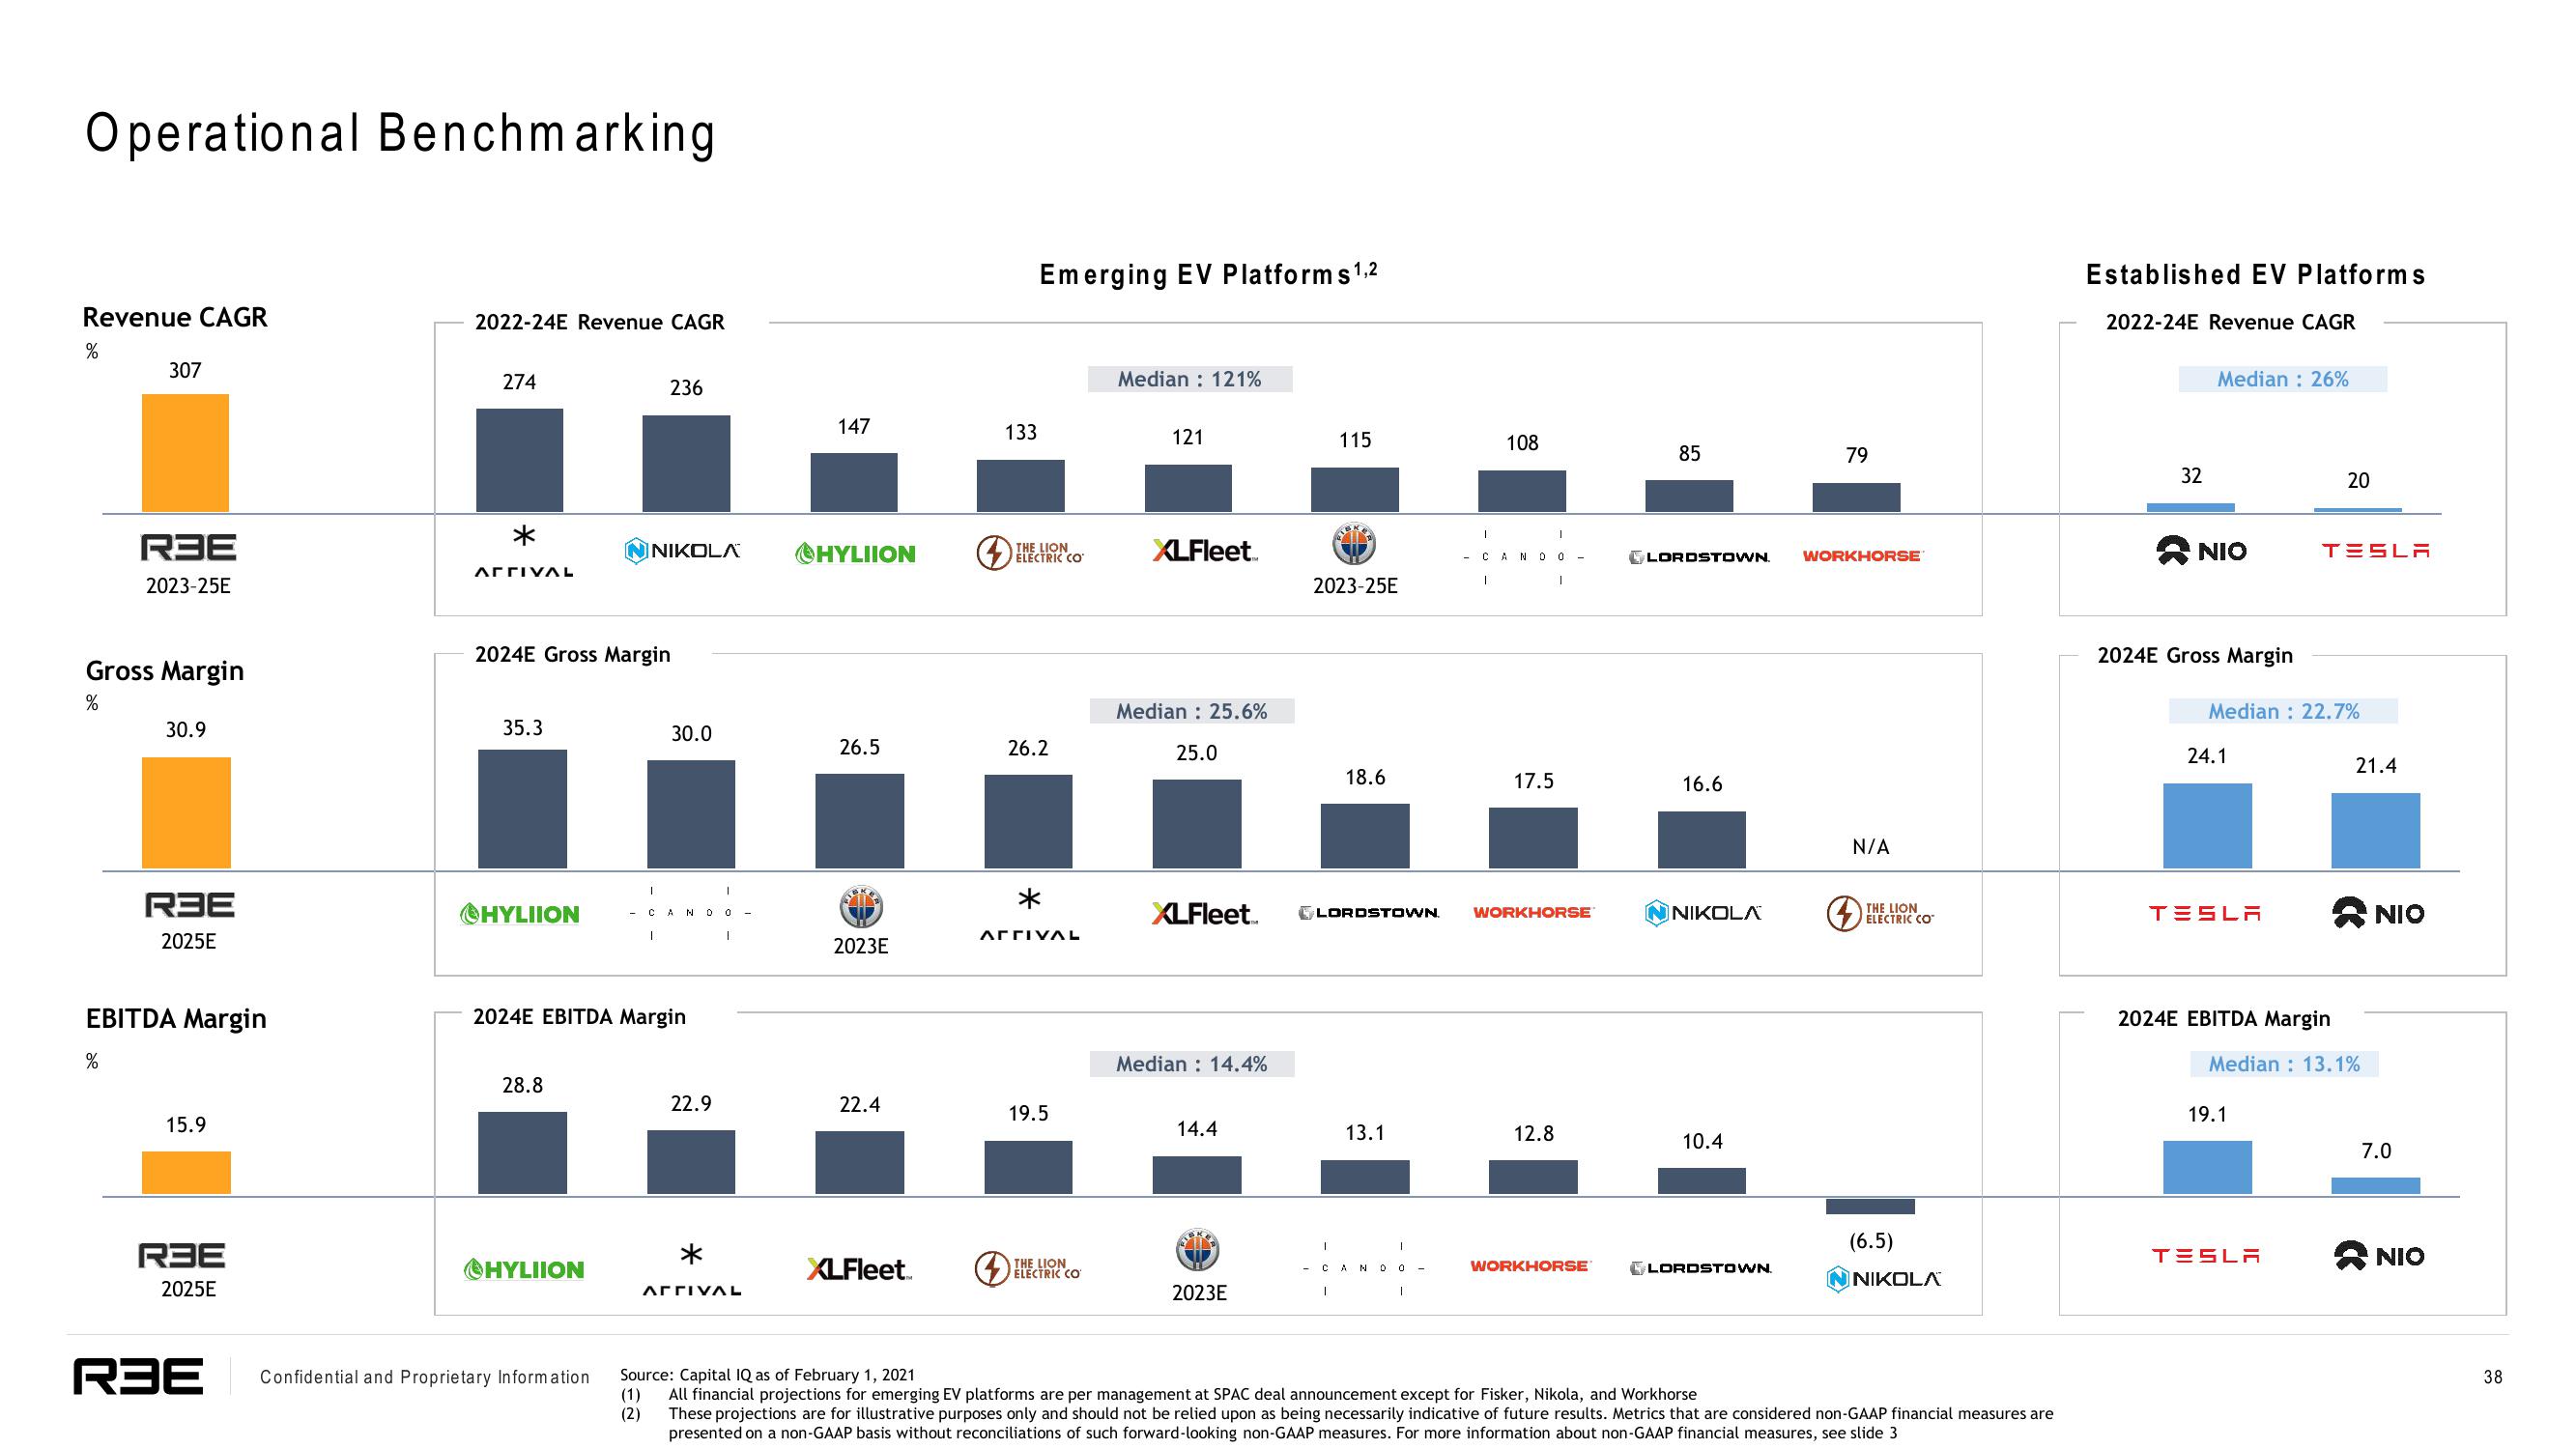
Operational Benchmarking
Revenue CAGR
%
307
RBE
2023-25E
Gross Margin
%
%
30.9
RBE
2025E
EBITDA Margin
15.9
RBE
2025E
RBE
2022-24E Revenue CAGR
274
ΑΓΓΙΥΛΕ
35.3
2024E Gross Margin
ⒸHYLIION
28.8
236
ⒸHYLIION
NIKOLA
Confidential and Proprietary Information
2024E EBITDA Margin
30.0
AN 0
22.9
ΑΓΓΙΥΛΕ
147
HYLIION
26.5
2023E
22.4
XLFleet
Emerging EV Platforms 1,2
133
(
THE LION
ELECTRIC CO
26.2
*
ΑΓΓΙΥΛΕ
19.5
THE LION
ELECTRIC CO
Median : 121%
121
XLFleet
Median 25.6%
25.0
XLFleet.
Median 14.4%
14.4
2023E
115
2023-25E
18.6
LORDSTOWN.
13.1
0 0
1
1
108
I
CANDO
17.5
1
12.8
1
WORKHORSE
WORKHORSE
85
LORDSTOWN.
16.6
NIKOLA
10.4
LORDSTOWN.
79
WORKHORSE
N/A
(
THE LION
ELECTRIC CO
(6.5)
NIKOLA
Source: Capital IQ as of February 1, 2021
(1) All financial projections for emerging EV platforms are per management at SPAC deal announcement except for Fisker, Nikola, and Workhorse
These projections are for illustrative purposes only and should not be relied upon as being necessarily indicative of future results. Metrics that are considered non-GAAP financial measures are
presented on a non-GAAP basis without reconciliations of such forward-looking non-GAAP measures. For more information about non-GAAP financial measures, see slide 3
(2)
Established EV Platforms
2022-24E Revenue CAGR
32
Median : 26%
NIO
2024E Gross Margin
24.1
Median: 22.7%
TESLA
2024E EBITDA Margin
20
TESLA
19.1
TESLA
Median: 13.1%
21.4
NIO
7.0
NIO
38View entire presentation