Markforged Results Presentation Deck
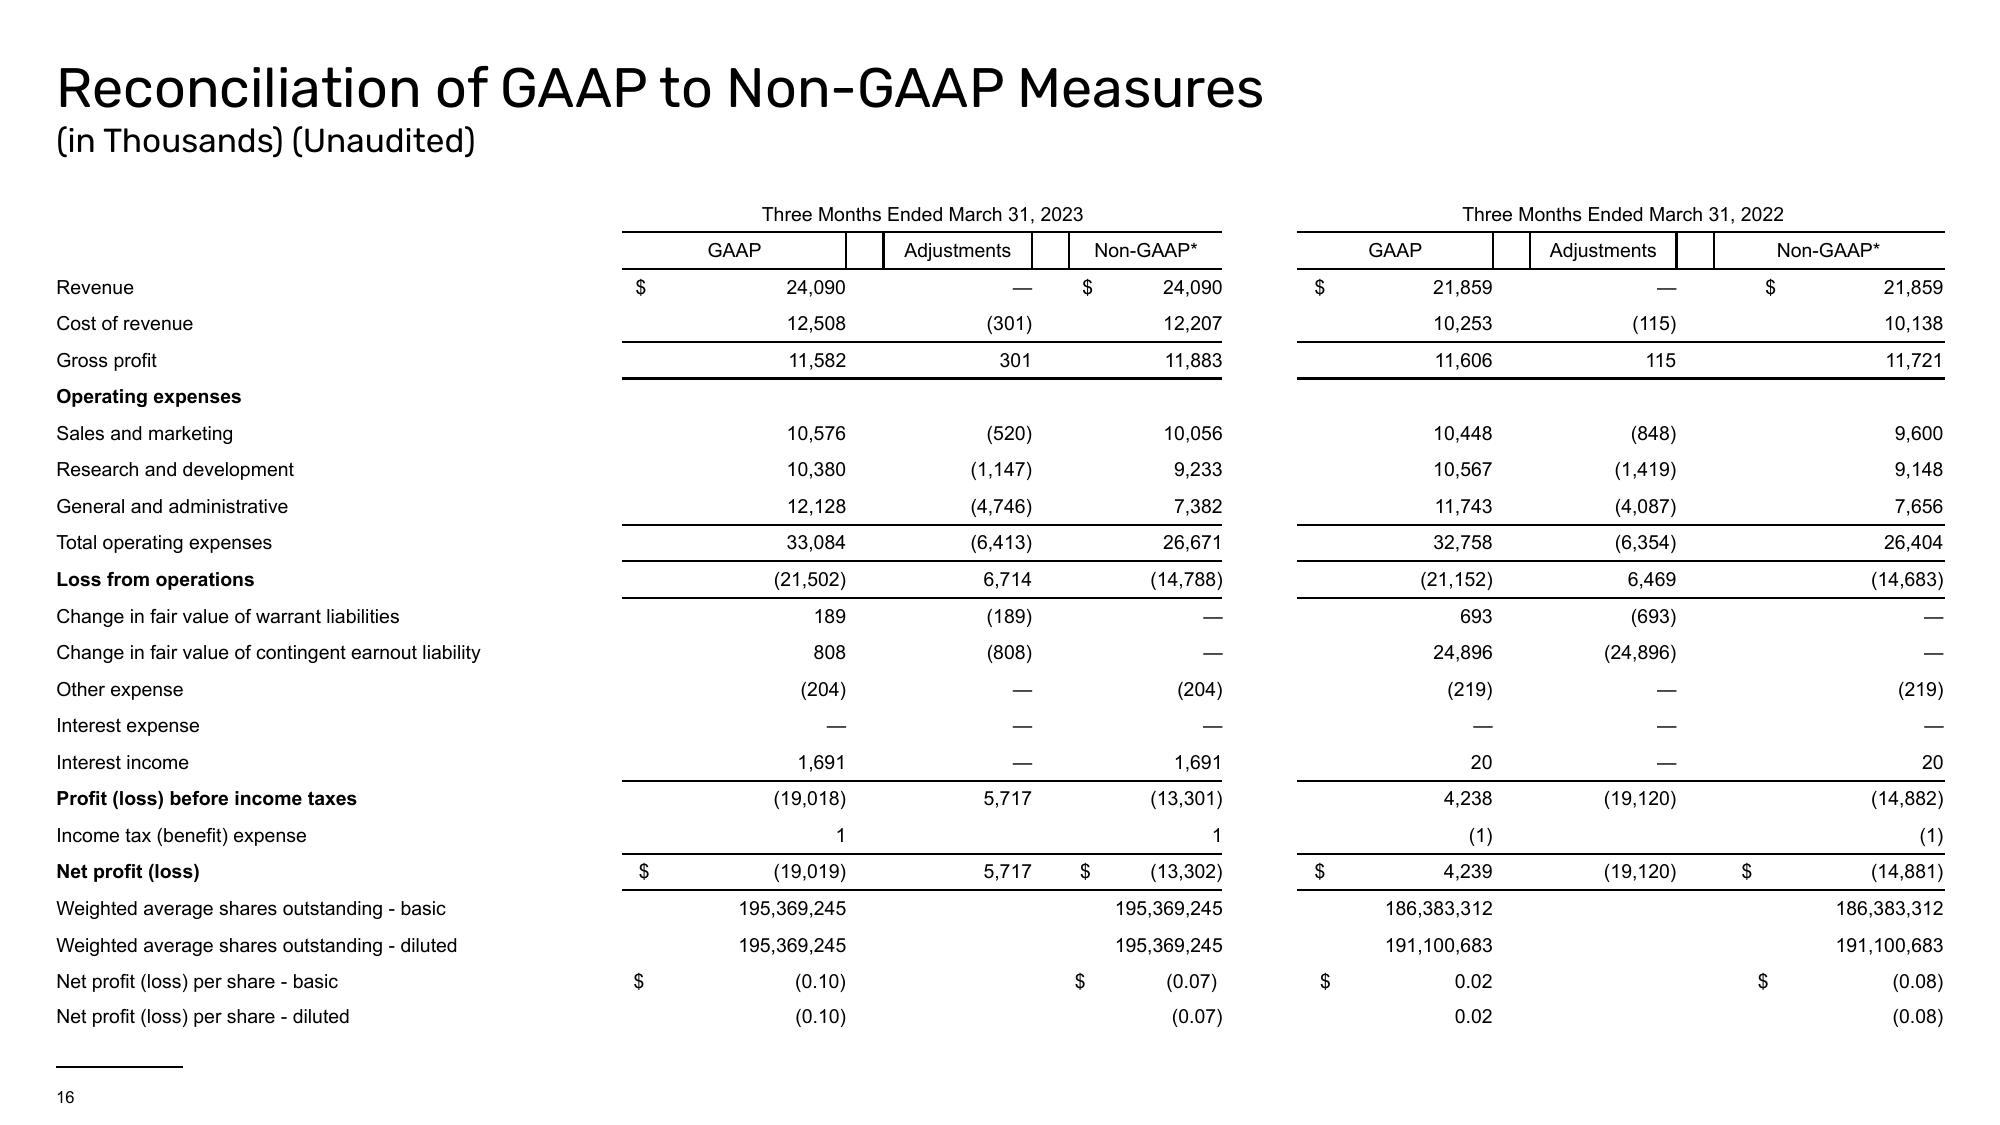
Reconciliation of GAAP to Non-GAAP Measures
(in Thousands) (Unaudited)
Revenue
Cost of revenue
Gross profit
Operating expenses
Sales and marketing
Research and development
General and administrative
Total operating expenses
Loss from operations
Change in fair value of warrant liabilities
Change in fair value of contingent earnout liability
Other expense
Interest expense
Interest income
Profit (loss) before income taxes
Income tax (benefit) expense
Net profit (loss)
Weighted average shares outstanding - basic
Weighted average shares outstanding - diluted
Net profit (loss) per share - basic
Net profit (loss) per share - diluted
16
$
$
$
GAAP
Three Months Ended March 31, 2023
Adjustments
24,090
12,508
11,582
10,576
10,380
12,128
33,084
(21,502)
189
808
(204)
1,691
(19,018)
1
(19,019)
195,369,245
195,369,245
(0.10)
(0.10)
(301)
301
(520)
(1,147)
(4,746)
(6,413)
6,714
(189)
(808)
5,717
5,717
$
$
Non-GAAP*
$
24,090
12,207
11,883
10,056
9,233
7,382
26,671
(14,788)
(204)
1,691
(13,301)
1
(13,302)
195,369,245
195,369,245
(0.07)
(0.07)
$
$
$
GAAP
Three Months Ended March 31, 2022
Adjustments
21,859
10,253
11,606
10,448
10,567
11,743
32,758
(21,152)
693
24,896
(219)
20
4,238
(1)
4,239
186,383,312
191,100,683
0.02
0.02
(115)
115
(848)
(1,419)
(4,087)
(6,354)
6,469
(693)
(24,896)
(19,120)
(19,120)
$
Non-GAAP*
$
$
21,859
10,138
11,721
9,600
9,148
7,656
26,404
(14,683)
(219)
20
(14,882)
(1)
(14,881)
186,383,312
191,100,683
(0.08)
(0.08)View entire presentation