Tempo SPAC Presentation Deck
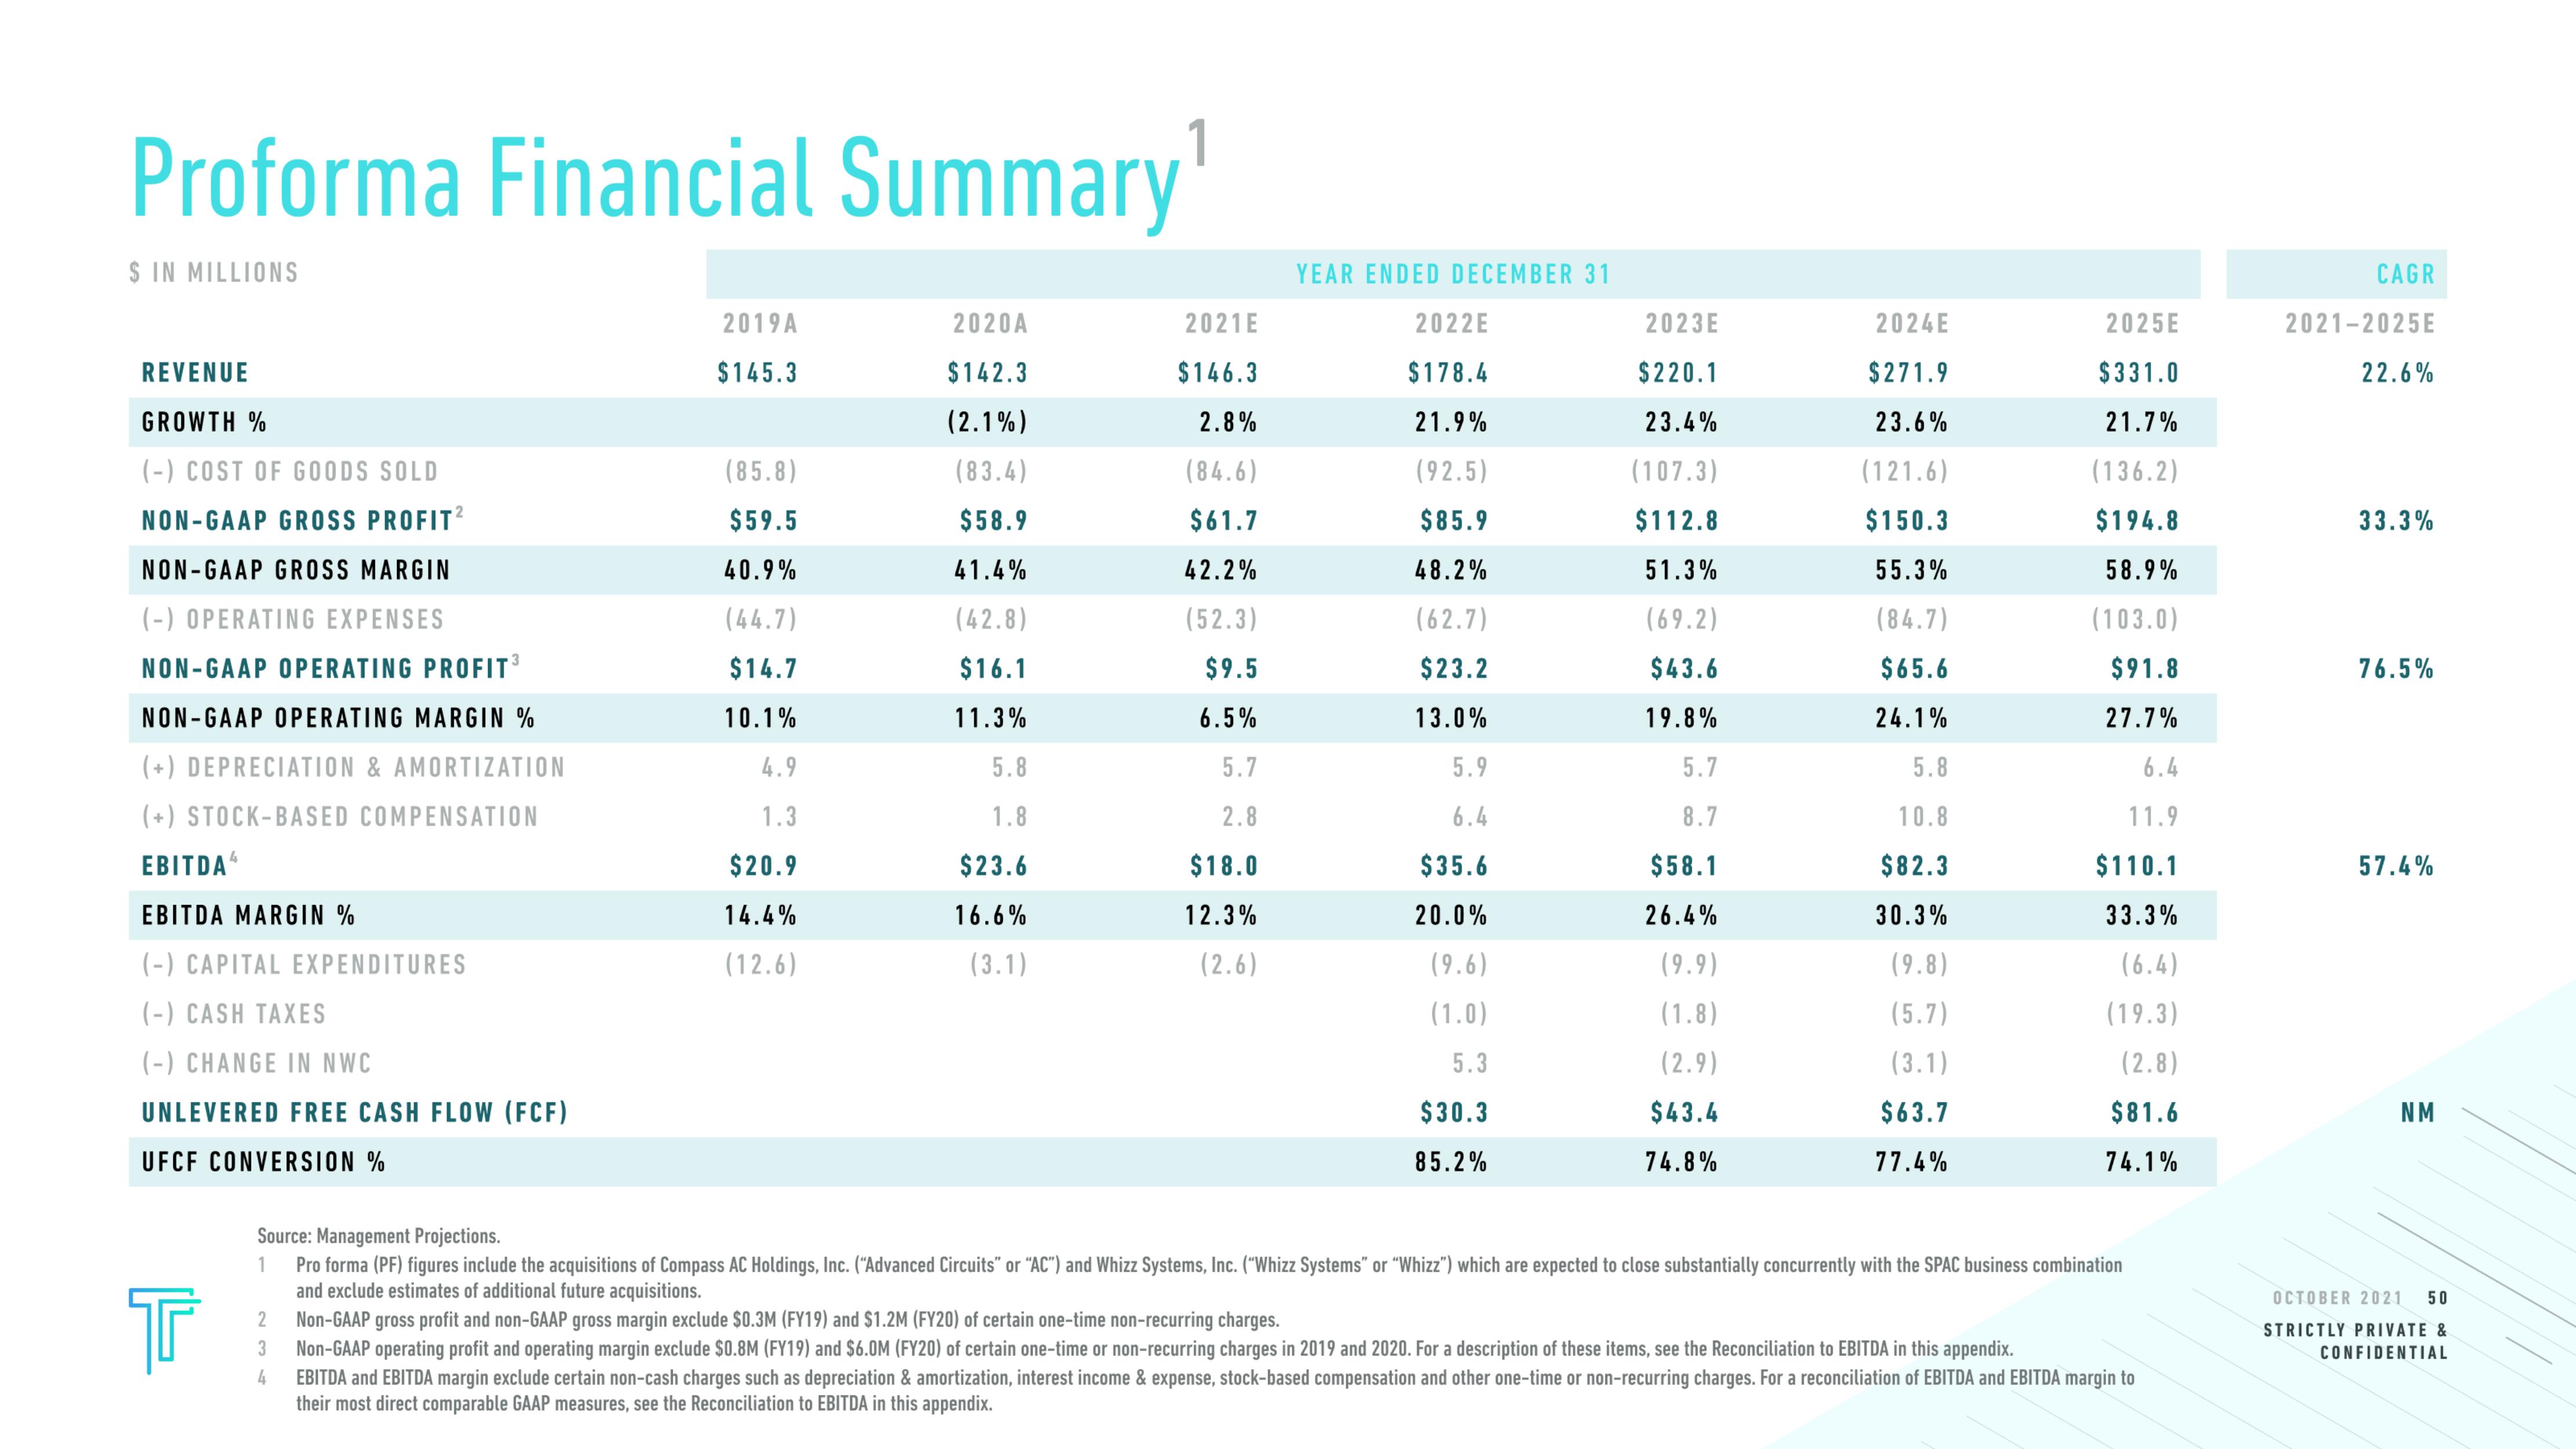
Proforma Financial Summary
$ IN MILLIONS
REVENUE
GROWTH %
(-) COST OF GOODS SOLD
NON-GAAP GROSS PROFIT²
NON-GAAP GROSS MARGIN
(-) OPERATING EXPENSES
NON-GAAP OPERATING PROFIT³
NON-GAAP OPERATING MARGIN %
(+) DEPRECIATION & AMORTIZATION
(+) STOCK-BASED COMPENSATION
EBITDA
EBITDA MARGIN %
(-) CAPITAL EXPENDITURES
(-) CASH TAXES
(-) CHANGE IN NWC
UNLEVERED FREE CASH FLOW (FCF)
UFCF CONVERSION%
T
2
3
2019A
$145.3
4
(85.8)
$59.5
40.9%
(44.7)
$14.7
10.1%
4.9
1.3
$20.9
14.4%
(12.6)
2020A
$142.3
(2.1%)
(83.4)
$58.9
41.4%
(42.8)
$16.1
11.3%
5.8
1.8
$23.6
16.6%
(3.1)
2021E
$146.3
2.8%
(84.6)
$61.7
42.2%
(52.3)
$9.5
6.5%
5.7
2.8
$18.0
12.3%
(2.6)
YEAR ENDED DECEMBER 31
2022E
$178.4
21.9%
(92.5)
$85.9
48.2%
(62.7)
$23.2
13.0%
5.9
6.4
$35.6
20.0%
(9.6)
(1.0)
5.3
$30.3
85.2%
2023E
$220.1
23.4%
(107.3)
$112.8
51.3%
(69.2)
$43.6
19.8%
5.7
8.7
$58.1
26.4%
(9.9)
(1.8)
(2.9)
$43.4
74.8%
2024E
$271.9
23.6%
(121.6)
$150.3
55.3%
(84.7)
$65.6
24.1%
5.8
10.8
$82.3
30.3%
(9.8)
(5.7)
(3.1)
$63.7
77.4%
2025E
$331.0
21.7%
(136.2)
$194.8
58.9%
(103.0)
$91.8
27.7%
Source: Management Projections.
1 Pro forma (PF) figures include the acquisitions of Compass AC Holdings, Inc. ("Advanced Circuits" or "AC") and Whizz Systems, Inc. ("Whizz Systems" or "Whizz") which are expected to close substantially concurrently with the SPAC business combination
and exclude estimates of additional future acquisitions.
Non-GAAP gross profit and non-GAAP gross margin exclude $0.3M (FY19) and $1.2M (FY20) of certain one-time non-recurring charges.
Non-GAAP operating profit and operating margin exclude $0.8M (FY19) and $6.0M (FY20) of certain one-time or non-recurring charges in 2019 and 2020. For a description of these items, see the Reconciliation to EBITDA in this appendix.
EBITDA and EBITDA margin exclude certain non-cash charges such as depreciation & amortization, interest income & expense, stock-based compensation and other one-time or non-recurring charges. For a reconciliation of EBITDA and EBITDA margin to
their most direct comparable GAAP measures, see the Reconciliation to EBITDA in this appendix.
6.4
11.9
$110.1
33.3%
(6.4)
(19.3)
(2.8)
$81.6
74.1%
CAGR
2021-2025E
22.6%
33.3%
76.5%
57.4%
NM
OCTOBER 2021 50
STRICTLY PRIVATE &
CONFIDENTIALView entire presentation