JD Sports Results Presentation Deck
September 2021
Revenue to Jul 2020 (Em)
Revenue to Jul 2021 (Em)
Gross Profit to Jul 2020 (%)
Gross Profit to Jul 2021 (%)
Divisional Profit / (Loss) to Jul 2020
(£m)
Divisional Profit / (Loss) to Jul 2021
(£m)
Number of Stores End of Period
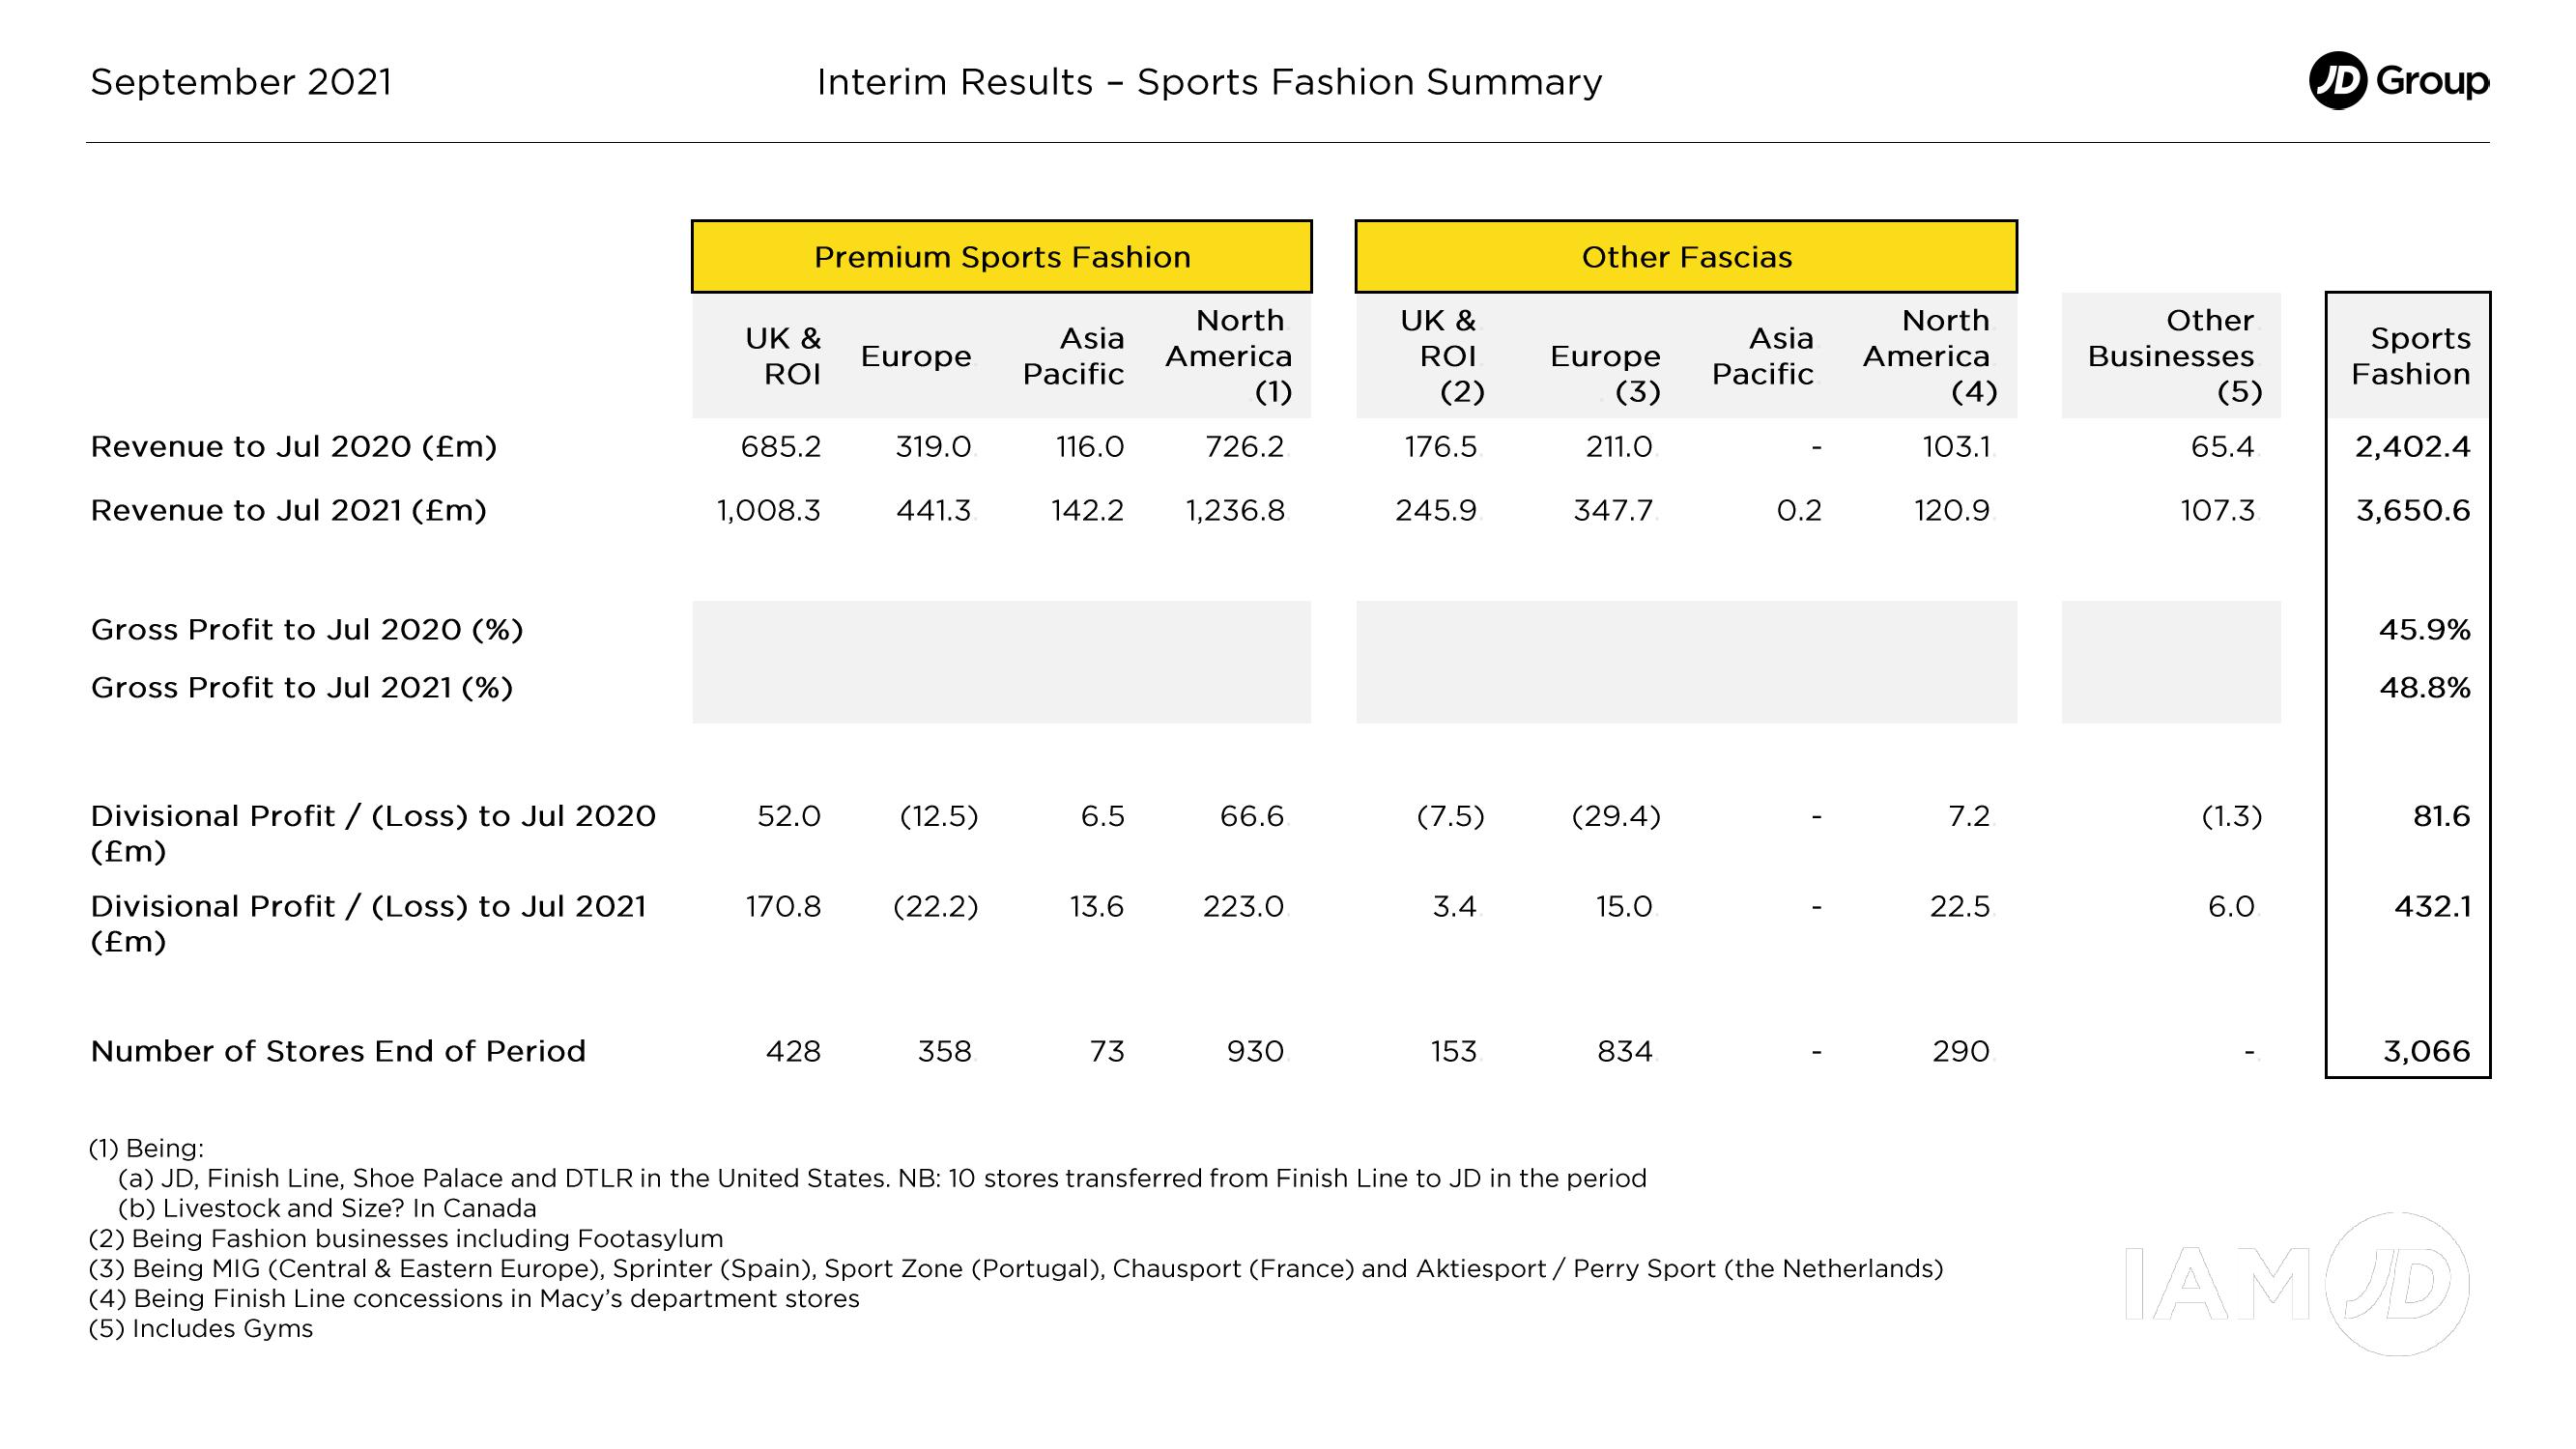
Interim Results - Sports Fashion Summary
685.
Premium Sports Fashion
UK &
ROI
1,008.3
52.0
170.8
428
Europe
441.3
(12.5)
(22.2)
358
Asia
Pacific
116.0
142.2 1,236.8
6.5
13.6
North
America
(1)
73
66.6
223.0
930
UK &
ROI
(2)
176.5
245.9
(7.5)
3.4
153
Other Fascias
Europe
(3)
211.0
347.7
(29.4)
15.0
834
(1) Being:
(a) JD, Finish Line, Shoe Palace and DTLR in the United States. NB: 10 stores transferred from Finish Line to JD in the period
(b) Livestock and Size? In Canada
Asia
Pacific
0.2
North
America
(4)
103
120.9
7.2
22.5
290
(2) Being Fashion businesses including Footasylum
(3) Being MIG (Central & Eastern Europe), Sprinter (Spain), Sport Zone (Portugal), Chausport (France) and Aktiesport / Perry Sport (the Netherlands)
(4) Being Finish Line concessions in Macy's department stores
(5) Includes Gyms
Other
Businesses
(5)
5.4
107.3
(1.3)
6.0
JD Group
Sports
Fashion
2,402.4
3,650.6
45.9%
48.8%
81.6
432.1
3,066
IAMUDView entire presentation