Sonder Investor Presentation Deck
Non-GAAP Reconciliations
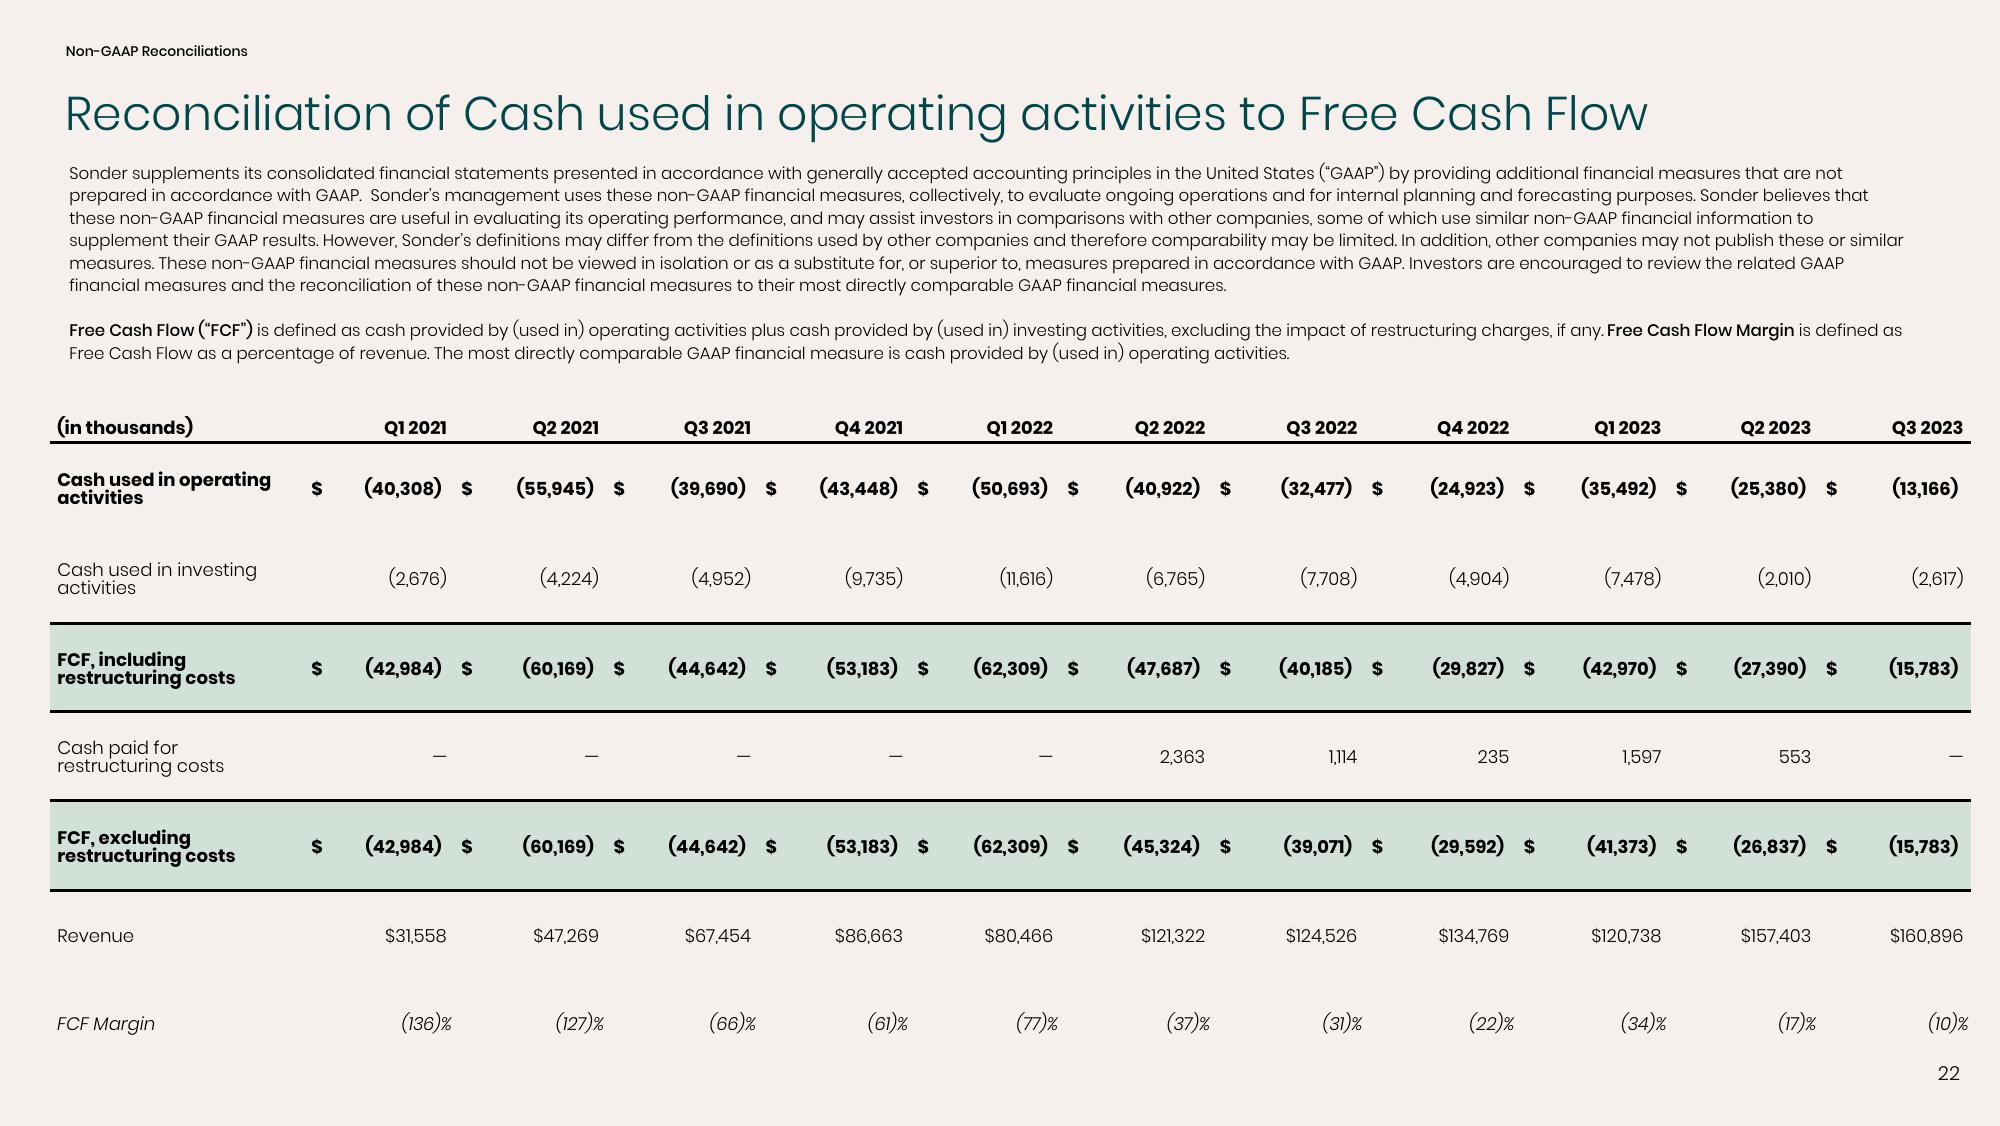
Reconciliation of Cash used in operating activities to Free Cash Flow
Sonder supplements its consolidated financial statements presented in accordance with generally accepted accounting principles in the United States ("GAAP") by providing additional financial measures that are not
prepared in accordance with GAAP. Sonder's management uses these non-GAAP financial measures, collectively, to evaluate ongoing operations and for internal planning and forecasting purposes. Sonder believes that
these non-GAAP financial measures are useful in evaluating its operating performance, and may assist investors in comparisons with other companies, some of which use similar non-GAAP financial information to
supplement their GAAP results. However, Sonder's definitions may differ from the definitions used by other companies and therefore comparability may be limited. In addition, other companies may not publish these or similar
measures. These non-GAAP financial measures should not be viewed in isolation or as a substitute for, or superior to, measures prepared in accordance with GAAP. Investors are encouraged to review the related GAAP
financial measures and the reconciliation of these non-GAAP financial measures to their most directly comparable GAAP financial measures.
Free Cash Flow ("FCF") is defined as cash provided by (used in) operating activities plus cash provided by (used in) investing activities, excluding the impact of restructuring charges, if any. Free Cash Flow Margin is defined as
Free Cash Flow as a percentage of revenue. The most directly comparable GAAP financial measure is cash provided by (used in) operating activities.
(in thousands)
Cash used in operating $
activities
Cash used in investing
activities
FCF, including
restructuring costs
Cash paid for
restructuring costs
FCF, excluding
restructuring costs
Revenue
FCF Margin
Q1 2021
(40,308) $
(2,676)
$ (42,984) S
$ (42,984) S
$31,558
(136)%
Q2 2021
(55,945) $
(4,224)
Q3 2021
$47,269
(39,690) $
(60,169) $ (44,642) S
(127)%
(4,952)
(60,169) $ (44,642) $
$67,454
(66)%
Q4 2021
(43,448) S
(9,735)
(53,183) S
(53,183) $
$86,663
(61)%
Q1 2022
(50,693) $
(11,616)
(62,309) S
(62,309) $
$80,466
(77)%
Q2 2022
(40,922) $
(6,765)
(47,687) $
2,363
(45,324) $
$121,322
(37)%
Q3 2022
(32,477) $
(7,708)
(40,185) $
1,114
$124,526
Q4 2022
(31)%
(24,923) $
(4,904)
(29,827) $
(39,071) $ (29,592) $
235
$134,769
(22)%
Q1 2023
(35,492) $
(7,478)
(42,970) $
1,597
(41,373) $
$120,738
(34)%
Q2 2023
(25,380) $
(2,010)
(27,390) $
553
(26,837) $
$157,403
(17)%
Q3 2023
(13,166)
(2,617)
(15,783)
(15,783)
$160,896
(10)%
22View entire presentation