Baird Investment Banking Pitch Book
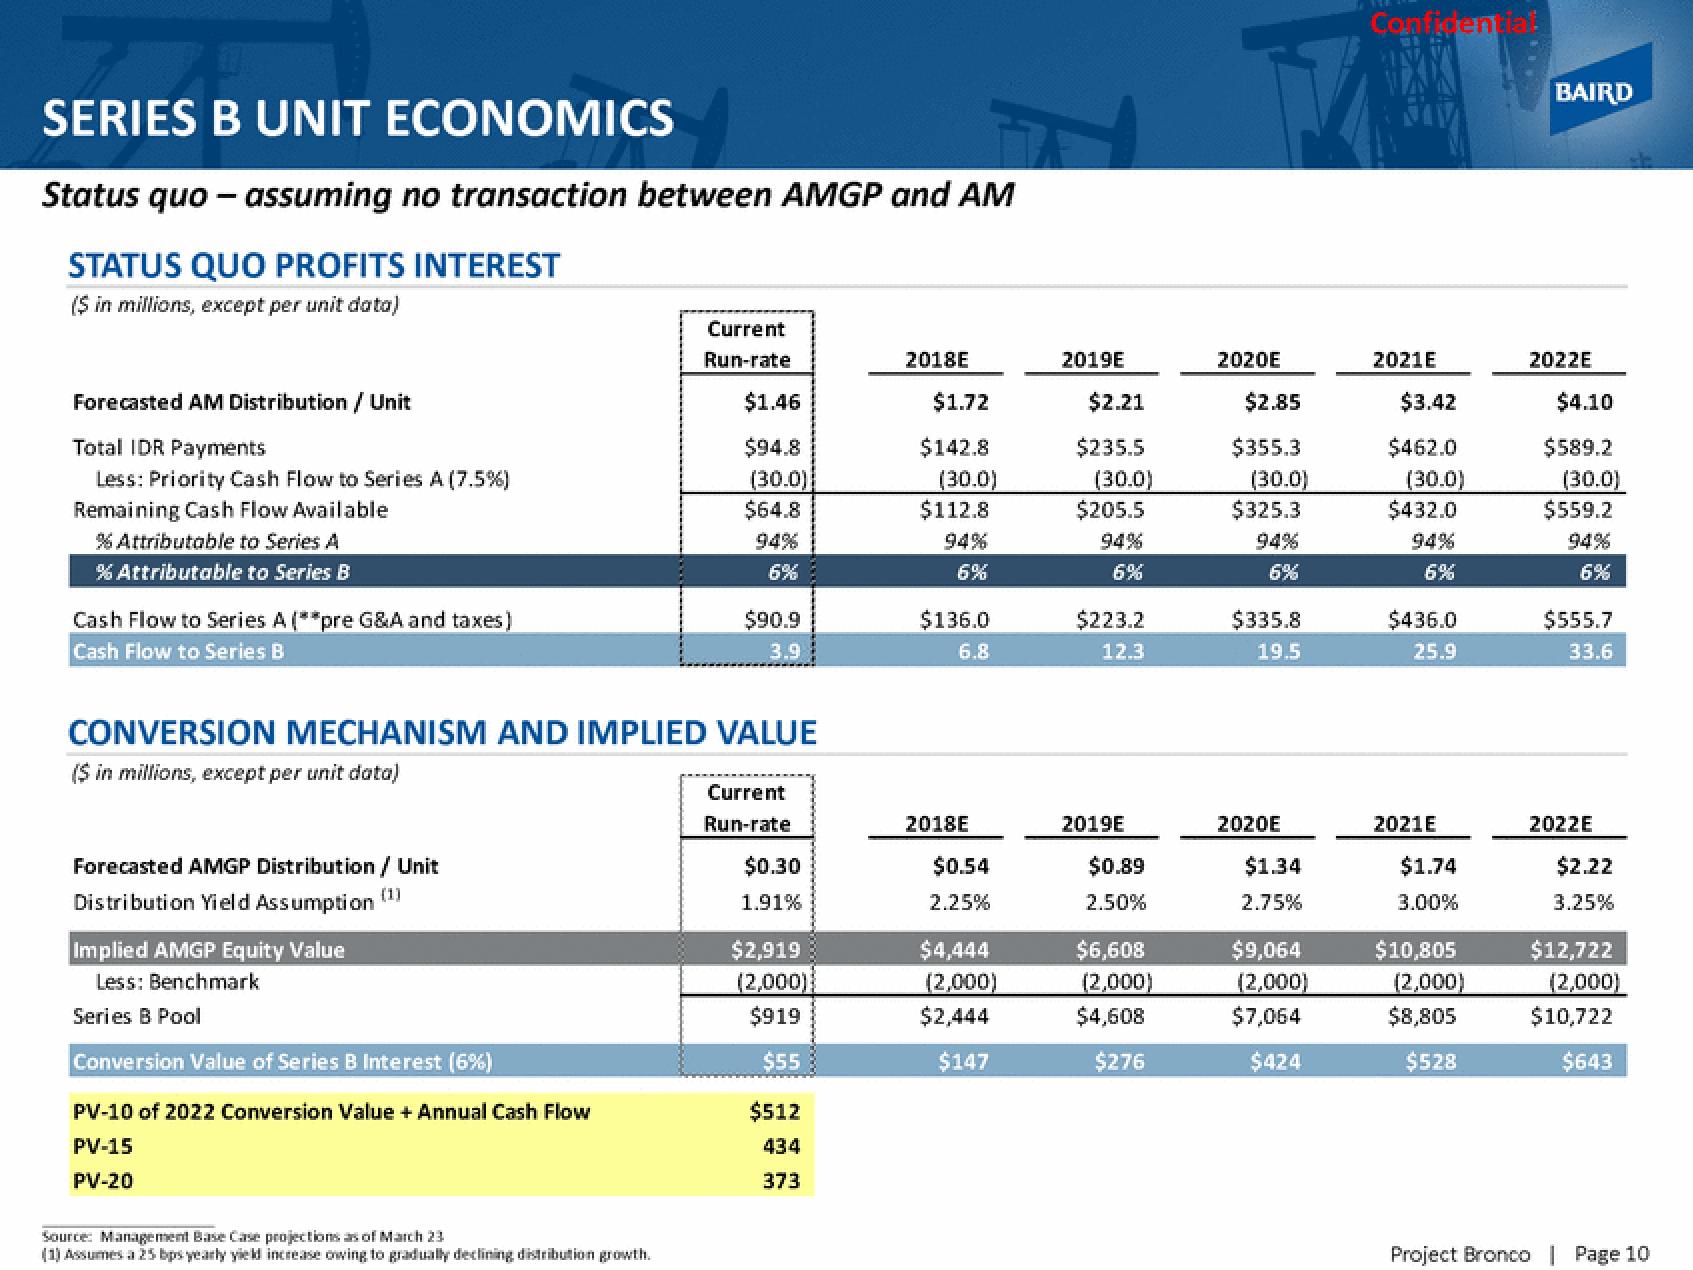
SERIES B UNIT ECONOMICS
Status quo - assuming no transaction between AMGP and AM
STATUS QUO PROFITS INTEREST
($ in millions, except per unit data)
Forecasted AM Distribution / Unit
Total IDR Payments
Less: Priority Cash Flow to Series A (7.5%)
Remaining Cash Flow Available
% Attributable to Series A
% Attributable to Series B
Cash Flow to Series A (**pre G&A and taxes)
Cash Flow to Series B
Forecasted AMGP Distribution / Unit
(1)
Distribution Yield Assumption
Implied AMGP Equity Value
Less: Benchmark
CONVERSION MECHANISM AND IMPLIED VALUE
($ in millions, except per unit data)
Series B Pool
Conversion Value of Series B Interest (6%)
PV-10 of 2022 Conversion Value + Annual Cash Flow
PV-15
PV-20
Current
Run-rate
Source: Management Base Case projections as of March 23
(1) Assumes a 25 bps yearly yield increase owing to gradually declining distribution growth.
$1.46
$94.8
(30.0)
$64.8
94%
6%
$90.9
3.9
Current
Run-rate
$0.30
1.91%
$2,919
(2,000)
$919
$55
$512
434
373
2018E
$1.72
$142.8
(30.0)
$112.8
94%
6%
$136.0
6.8
2018E
$0.54
2.25%
$4,444
(2,000)
$2,444
$147
2019E
$2.21
$235.5
(30.0)
$205.5
6%
$223.2
12.3
2019E
$0.89
2.50%
$6,608
(2,000)
$4,608
$276
2020E
$2.85
$355.3
(30.0)
$325.3
94%
6%
$335.8
19.5
2020E
$1.34
2.75%
$9,064
(2,000)
$7,064
$424
Confidential
2021E
$3.42
$462.0
(30.0)
$432.0
94%
6%
$436.0
25.9
2021E
$1.74
3.00%
$10,805
(2,000)
$8,805
$528
BAIRD
2022E
$4.10
$589.2
(30.0)
$559.2
94%
6%
$555.7
33.6
2022E
$2.22
3.25%
$12,722
(2,000)
$10,722
$643
Project Bronco | Page 10View entire presentation