Bigbear AI SPAC Presentation Deck
Benchmarking
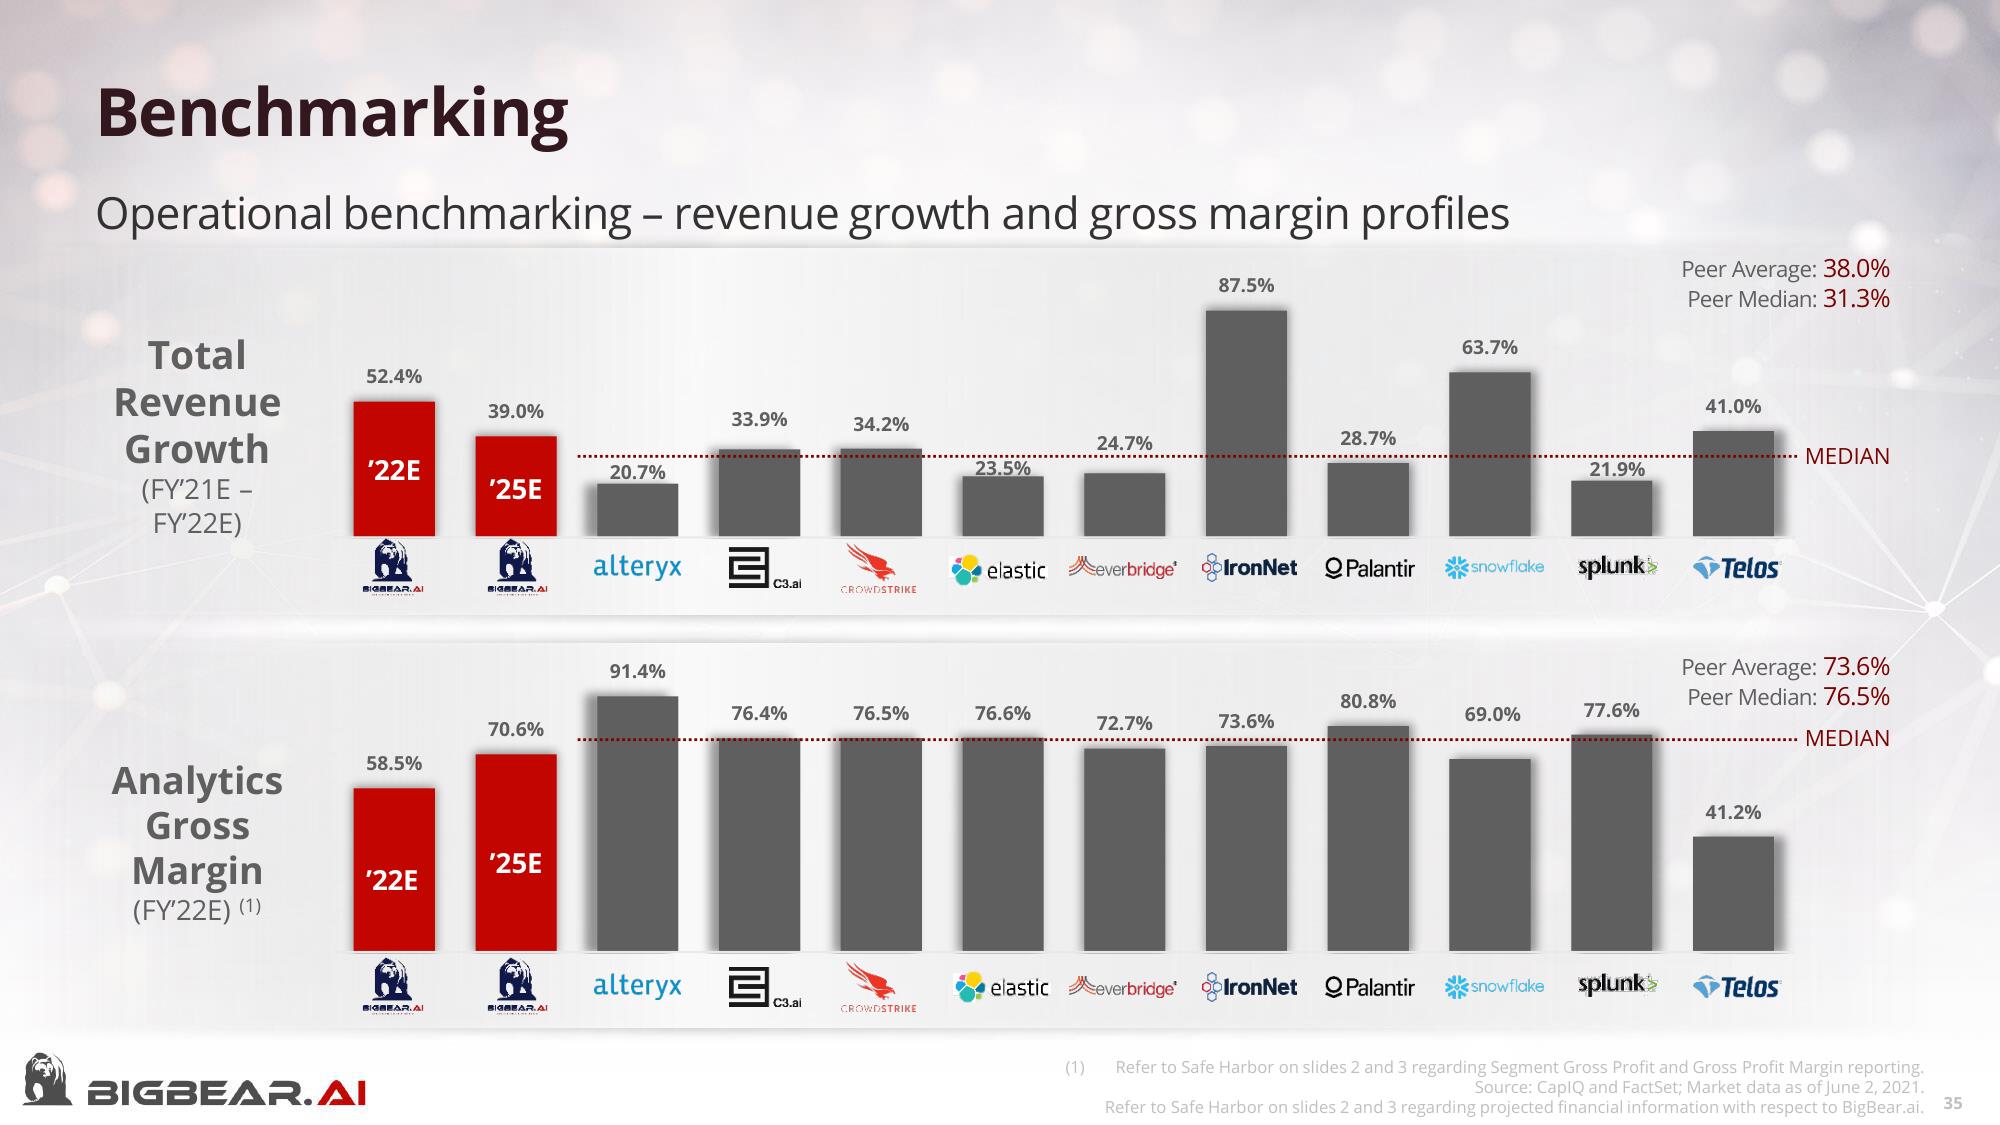
Operational benchmarking - revenue growth and gross margin profiles
Total
Revenue
Growth
(FY'21E-
FY'22E)
Analytics
Gross
Margin
(FY'22E) (¹)
52.4%
'22E
BIGHEAR.AI
58.5%
'22E
62
BIGHEAR.AL
BIGBEAR. AI
39.0%
'25E
BIGBEAR.AI
70.6%
'25E
BIGHEAR. AI
20.7%
33.9%
alteryx c3.al
91.4%
76.4%
alteryx ca.al
34.2%
CROWDSTRIKE
76.5%
CROWDSTRIKE
23.5%
76.6%
24.7%
(1)
72.7%
elastic everbridge
87.5%
elastic everbridge IronNet Palantir snowflake splunk>>
28.7%
73.6%
63.7%
80.8%
21.9%
69.0%
77.6%
IronNet Palantir snowflake splunks
Peer Average: 38.0%
Peer Median: 31.3%
41.0%
Telos
Peer Average: 73.6%
Peer Median: 76.5%
MEDIAN
41.2%
MEDIAN
Telos
Refer to Safe Harbor on slides 2 and 3 regarding Segment Gross Profit and Gross Profit Margin reporting.
Source: CapIQ and FactSet; Market data as of June 2, 2021.
Refer to Safe Harbor on slides 2 and 3 regarding projected financial information with respect to BigBear.ai. 35View entire presentation