PJT Partners Investment Banking Pitch Book
Appalachia Well Level Details
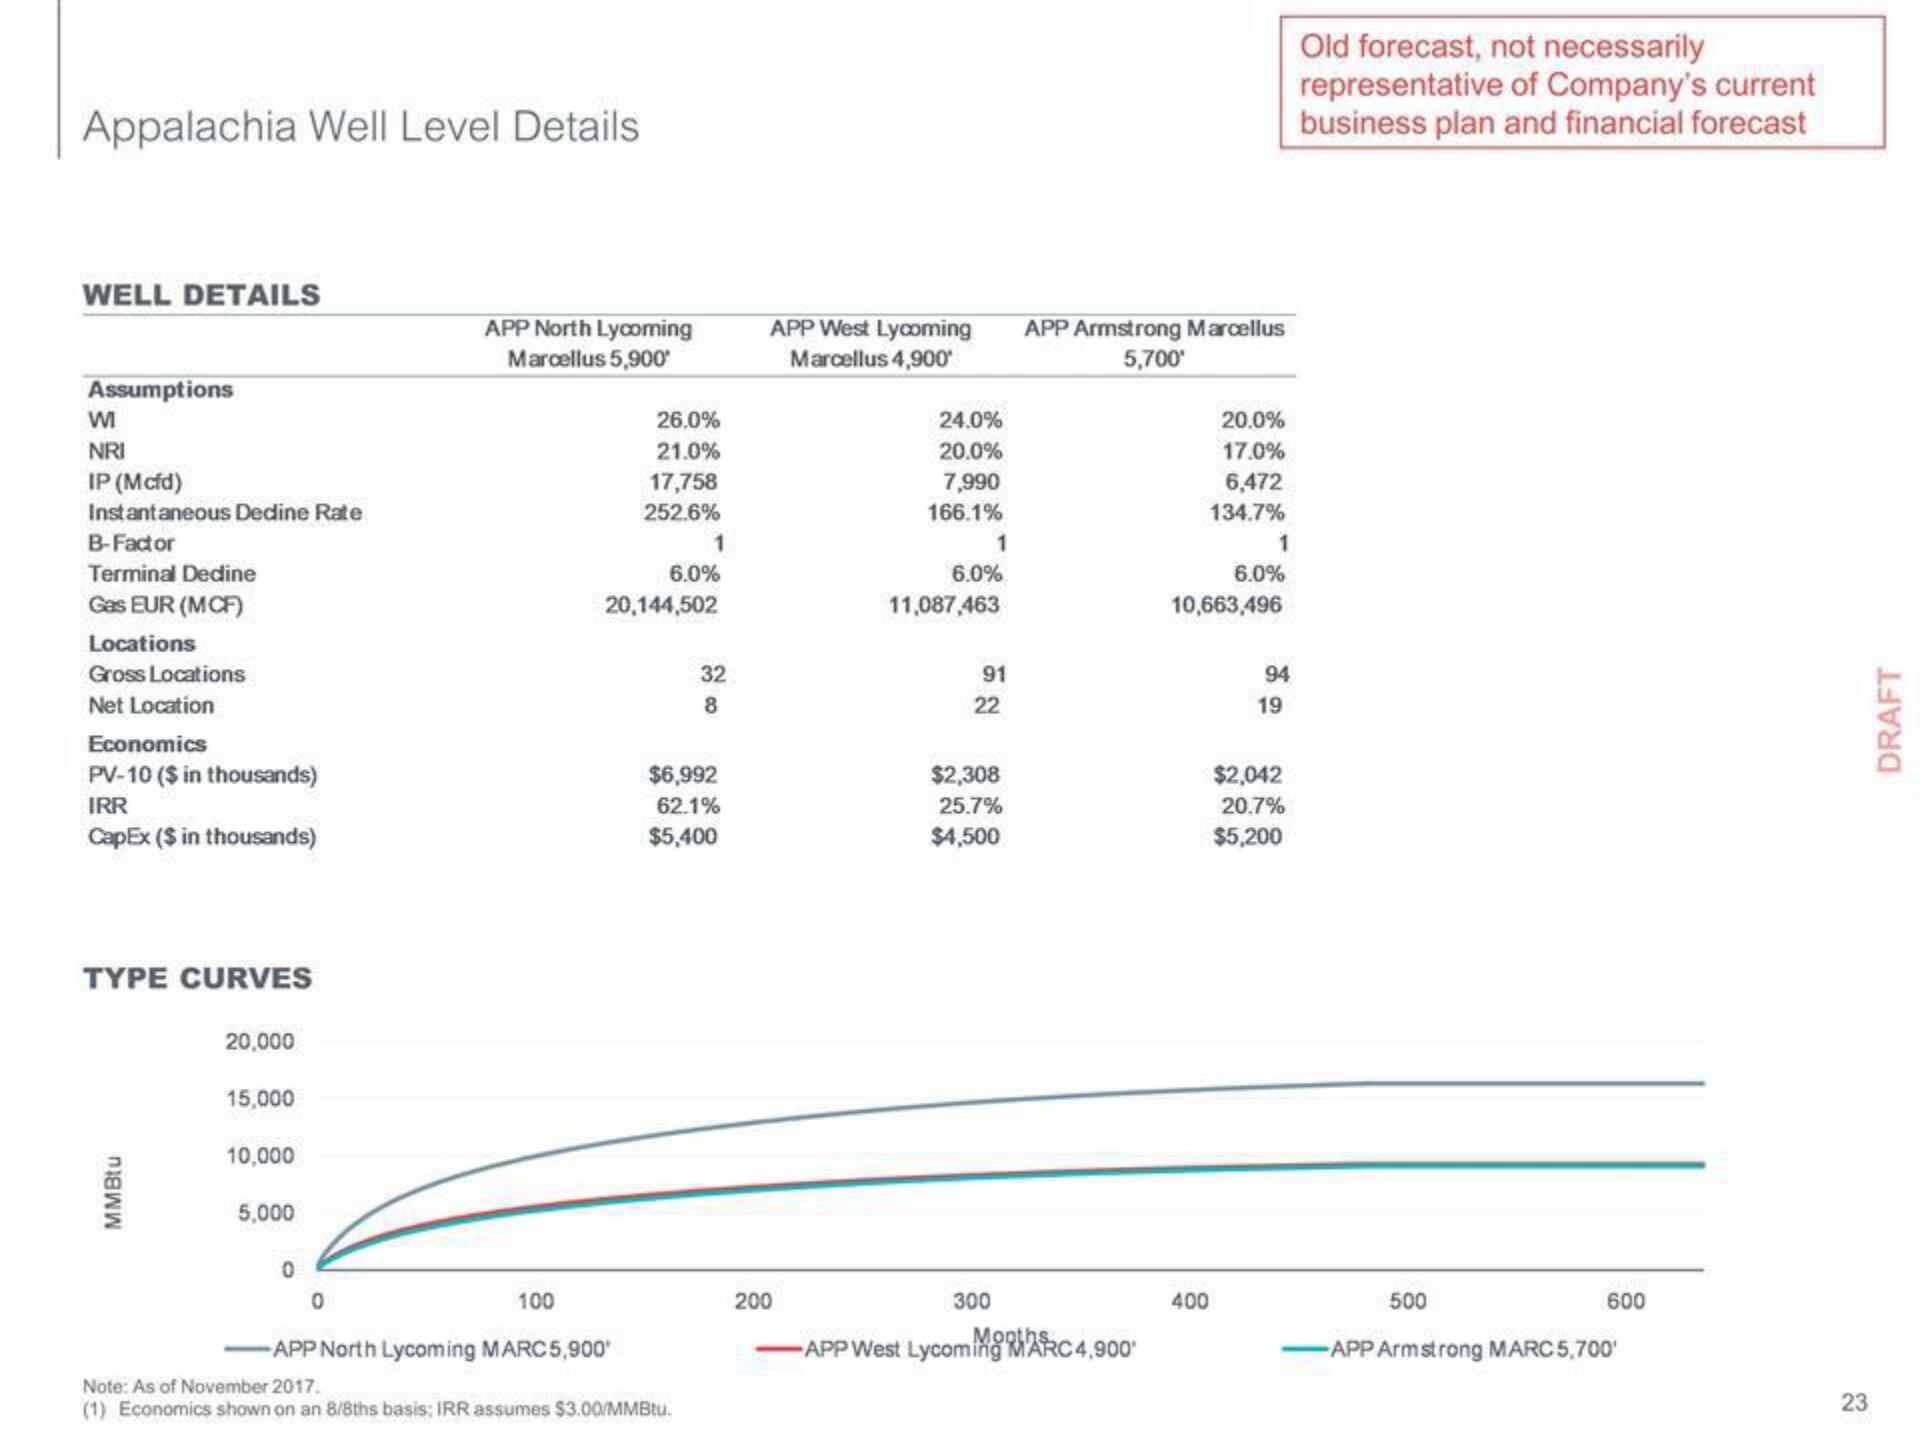
WELL DETAILS
Assumptions
WI
NRI
IP (Mcfd)
Instantaneous Dedine Rate
B-Factor
Terminal Dedine
Gas EUR (MCF)
Locations
Gross Locations
Net Location
Economics
PV-10 ($ in thousands)
IRR
CapEx ($ in thousands)
TYPE CURVES
MMBtu
20,000
15,000
10,000
5,000
0
0
APP North Lycoming
Marcellus 5,900'
100
26.0%
21.0%
17,758
252.6%
-APP North Lycoming MARC 5,900
6.0%
20,144,502
1
Note: As of November 2017.
(1) Economics shown on an 8/8ths basis; IRR assumes $3.00/MMBtu.
32
8
$6,992
62.1%
$5,400
APP West Lycoming
Marcellus 4,900'
200
24.0%
20.0%
7,990
166.1%
1
6.0%
11,087,463
91
22
$2,308
25.7%
$4,500
300
APP Armstrong Marcellus
5,700*
Mooths
-APP West Lycoming MARC 4,900
20.0%
17.0%
6,472
134.7%
1
6.0%
10,663,496
400
94
19
$2,042
20.7%
$5,200
Old forecast, not necessarily
representative of Company's current
business plan and financial forecast
500
600
-APP Armstrong MARC 5,700'
23
DRAFTView entire presentation