Goldman Sachs Investment Banking Pitch Book
Goldman
Sachs
Illustrative Valuation
Base Case Assumptions
For Reference
Summary of Financial Analyses
Financial Analyses
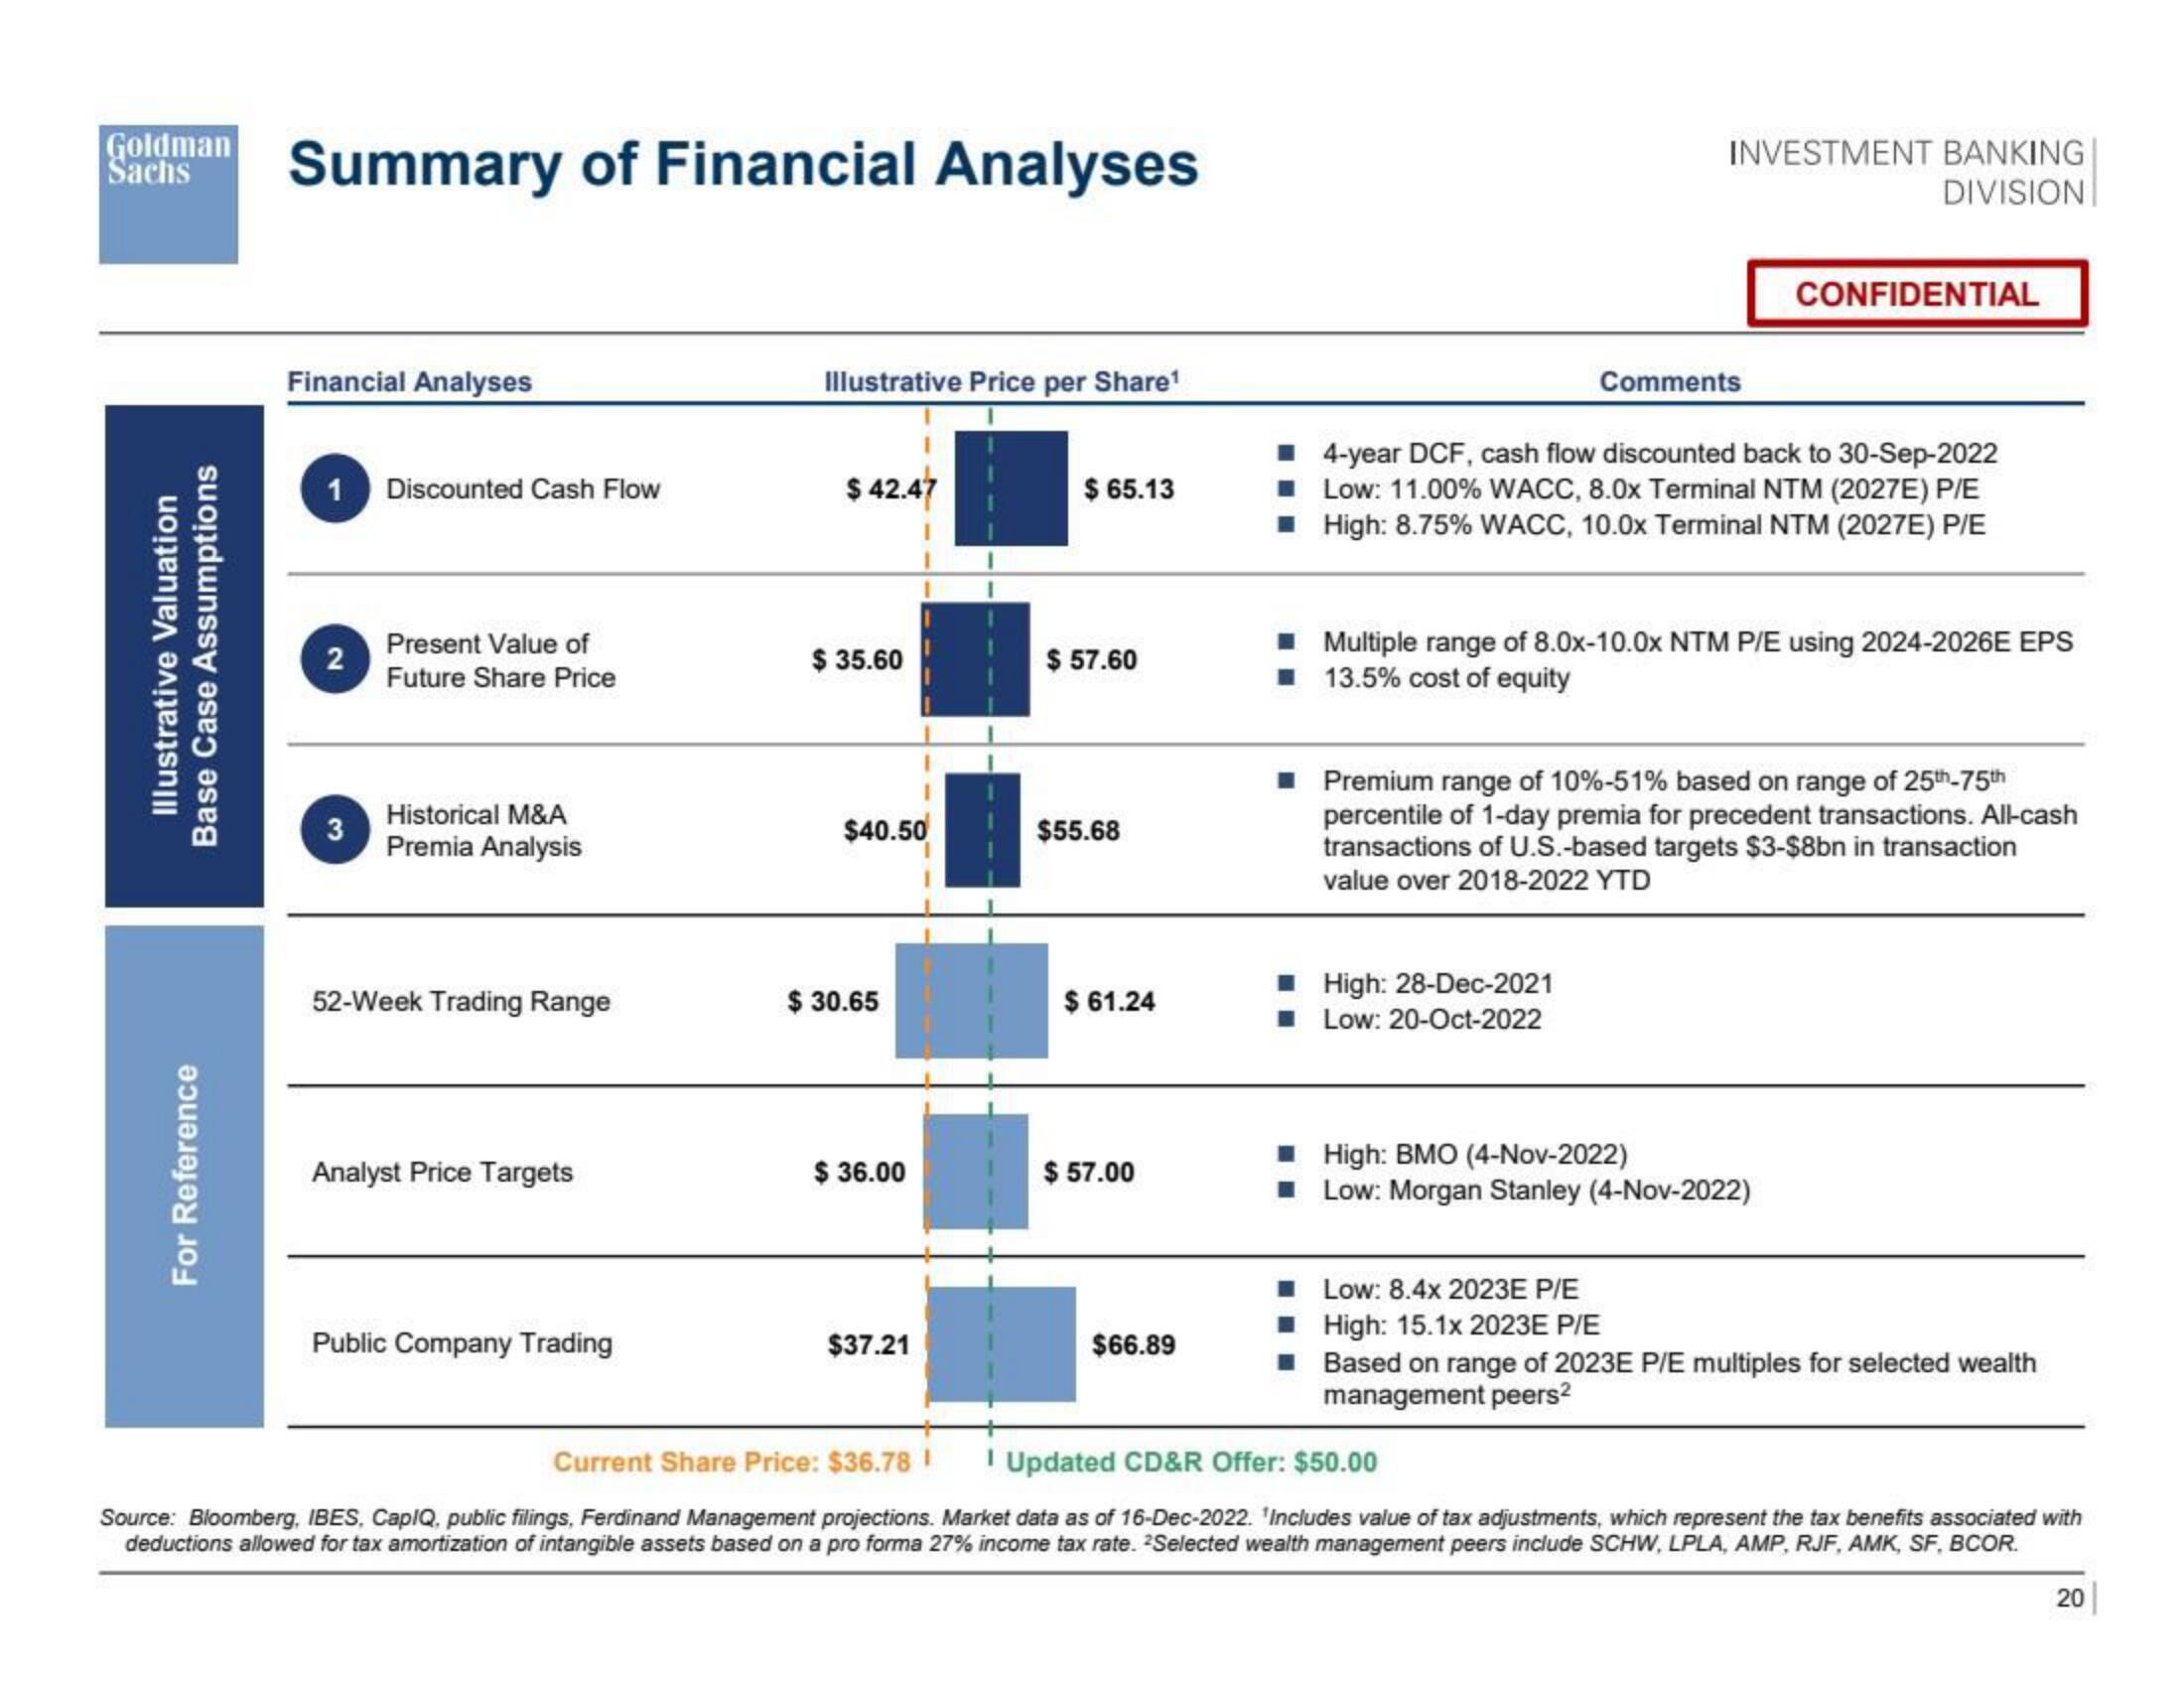
1 Discounted Cash Flow
2
3
Present Value of
Future Share Price
Historical M&A
Premia Analysis
52-Week Trading Range
Analyst Price Targets
Public Company Trading
Illustrative Price per Share¹
$ 42.47
$ 35.60
$40.50
$ 30.65
$36.00
$37.21
$ 65.13
$57.60
$55.68
$61.24
$57.00
$66.89
INVESTMENT BANKING
DIVISION
Comments
4-year DCF, cash flow discounted back to 30-Sep-2022
Low: 11.00% WACC, 8.0x Terminal NTM (2027E) P/E
■
■ High: 8.75% WACC, 10.0x Terminal NTM (2027E) P/E
■ High: 28-Dec-2021
■Low: 20-Oct-2022
CONFIDENTIAL
■ Multiple range of 8.0x-10.0x NTM P/E using 2024-2026E EPS
■ 13.5% cost of equity
■ Premium range of 10%-51% based on range of 25th-75th
percentile of 1-day premia for precedent transactions. All-cash
transactions of U.S.-based targets $3-$8bn in transaction
value over 2018-2022 YTD
High: BMO (4-Nov-2022)
■ Low: Morgan Stanley (4-Nov-2022)
■ Low: 8.4x 2023E P/E
■ High: 15.1x 2023E P/E
Based on range of 2023E P/E multiples for selected wealth
management peers²
Current Share Price: $36.78 1 1 Updated CD&R Offer: $50.00
Source: Bloomberg, IBES, CapIQ, public filings, Ferdinand Management projections. Market data as of 16-Dec-2022. 'Includes value of tax adjustments, which represent the tax benefits associated with
deductions allowed for tax amortization of intangible assets based on a pro forma 27% income tax rate. Selected wealth management peers include SCHW, LPLA, AMP, RJF, AMK, SF, BCOR.
20View entire presentation