Bed Bath & Beyond Results Presentation Deck
Q3 comp sales growth trends
●
●
Q3 PERFORMANCE HIGHLIGHTS & TRANSFORMATION UPDATE
●
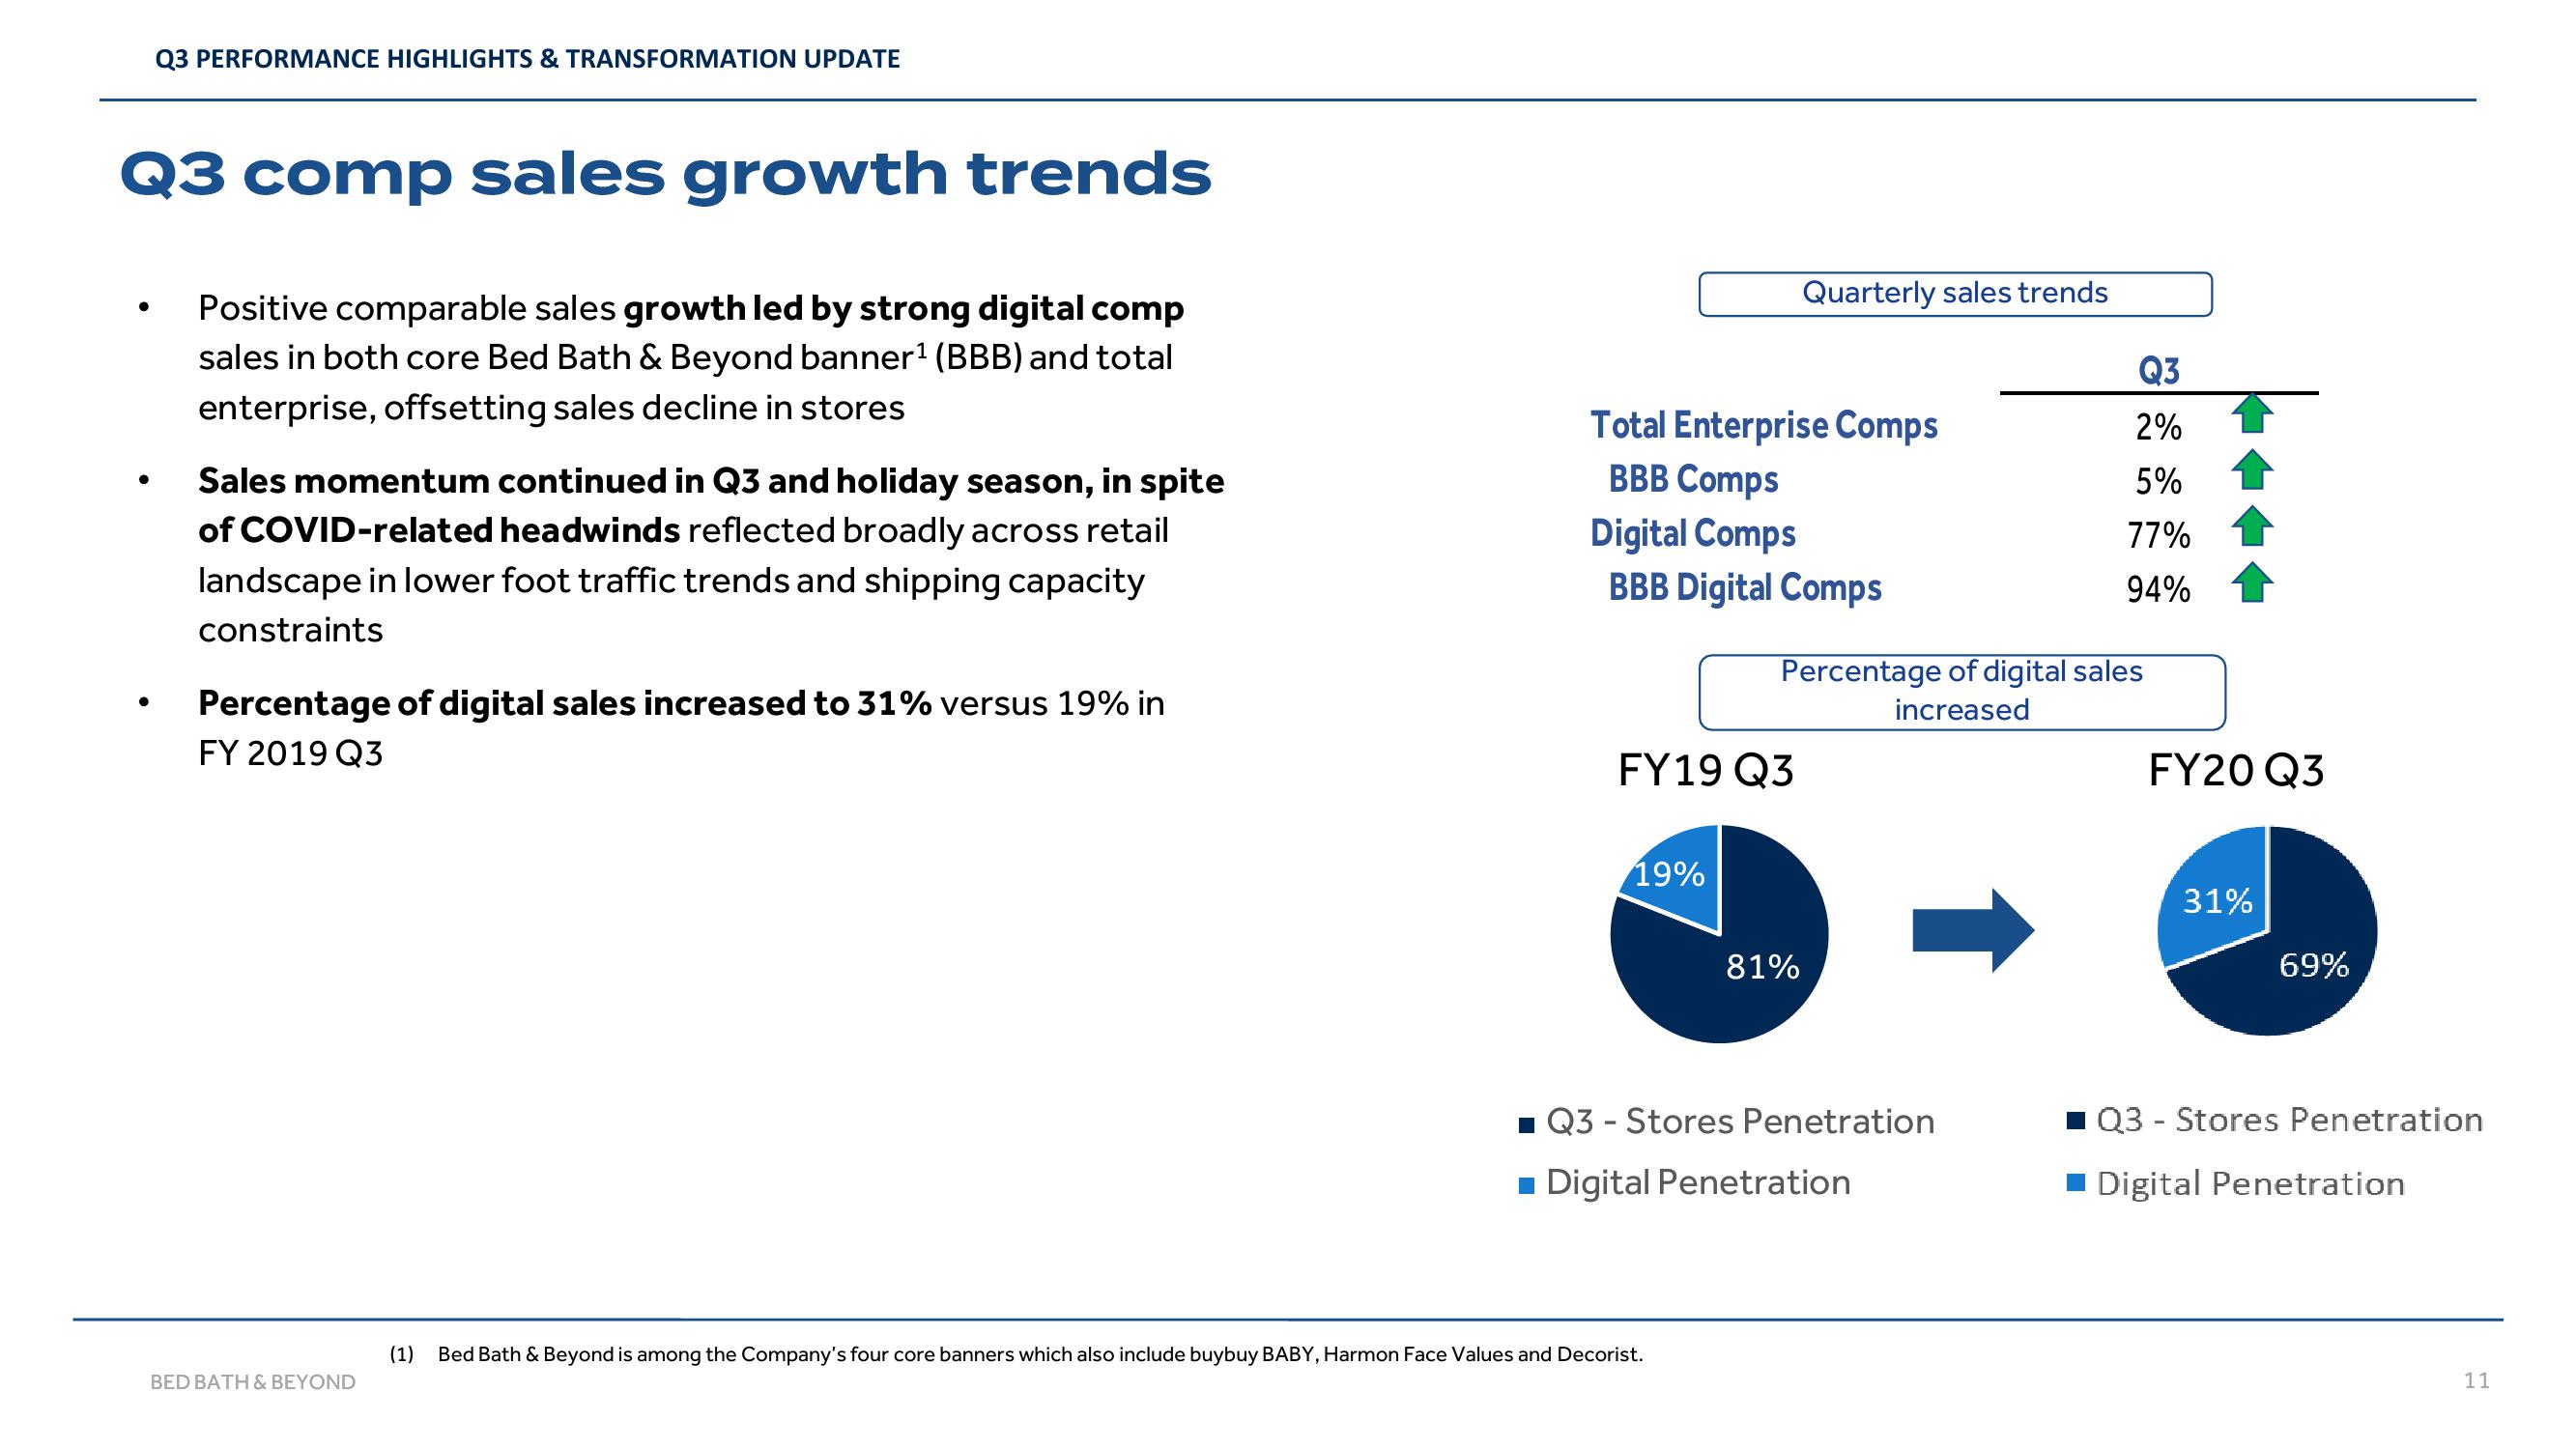
Positive comparable sales growth led by strong digital comp
sales in both core Bed Bath & Beyond banner¹ (BBB) and total
enterprise, offsetting sales decline in stores
Sales momentum continued in Q3 and holiday season, in spite
of COVID-related headwinds reflected broadly across retail
landscape in lower foot traffic trends and shipping capacity
constraints
Percentage of digital sales increased to 31% versus 19% in
FY 2019 Q3
BED BATH & BEYOND
Total Enterprise Comps
BBB Comps
Digital Comps
BBB Digital Comps
FY19 Q3
19%
Quarterly sales trends
(1) Bed Bath & Beyond is among the Company's four core banners which also include buybuy BABY, Harmon Face Values and Decorist.
Percentage of digital sales
increased
81%
■ Q3 - Stores Penetration
■ Digital Penetration
Q3
2%
5%
77%
94%
FY20 Q3
31%
69%
Q3 - Stores Penetration
Digital Penetration
11View entire presentation