Apollo Global Management Mergers and Acquisitions Presentation Deck
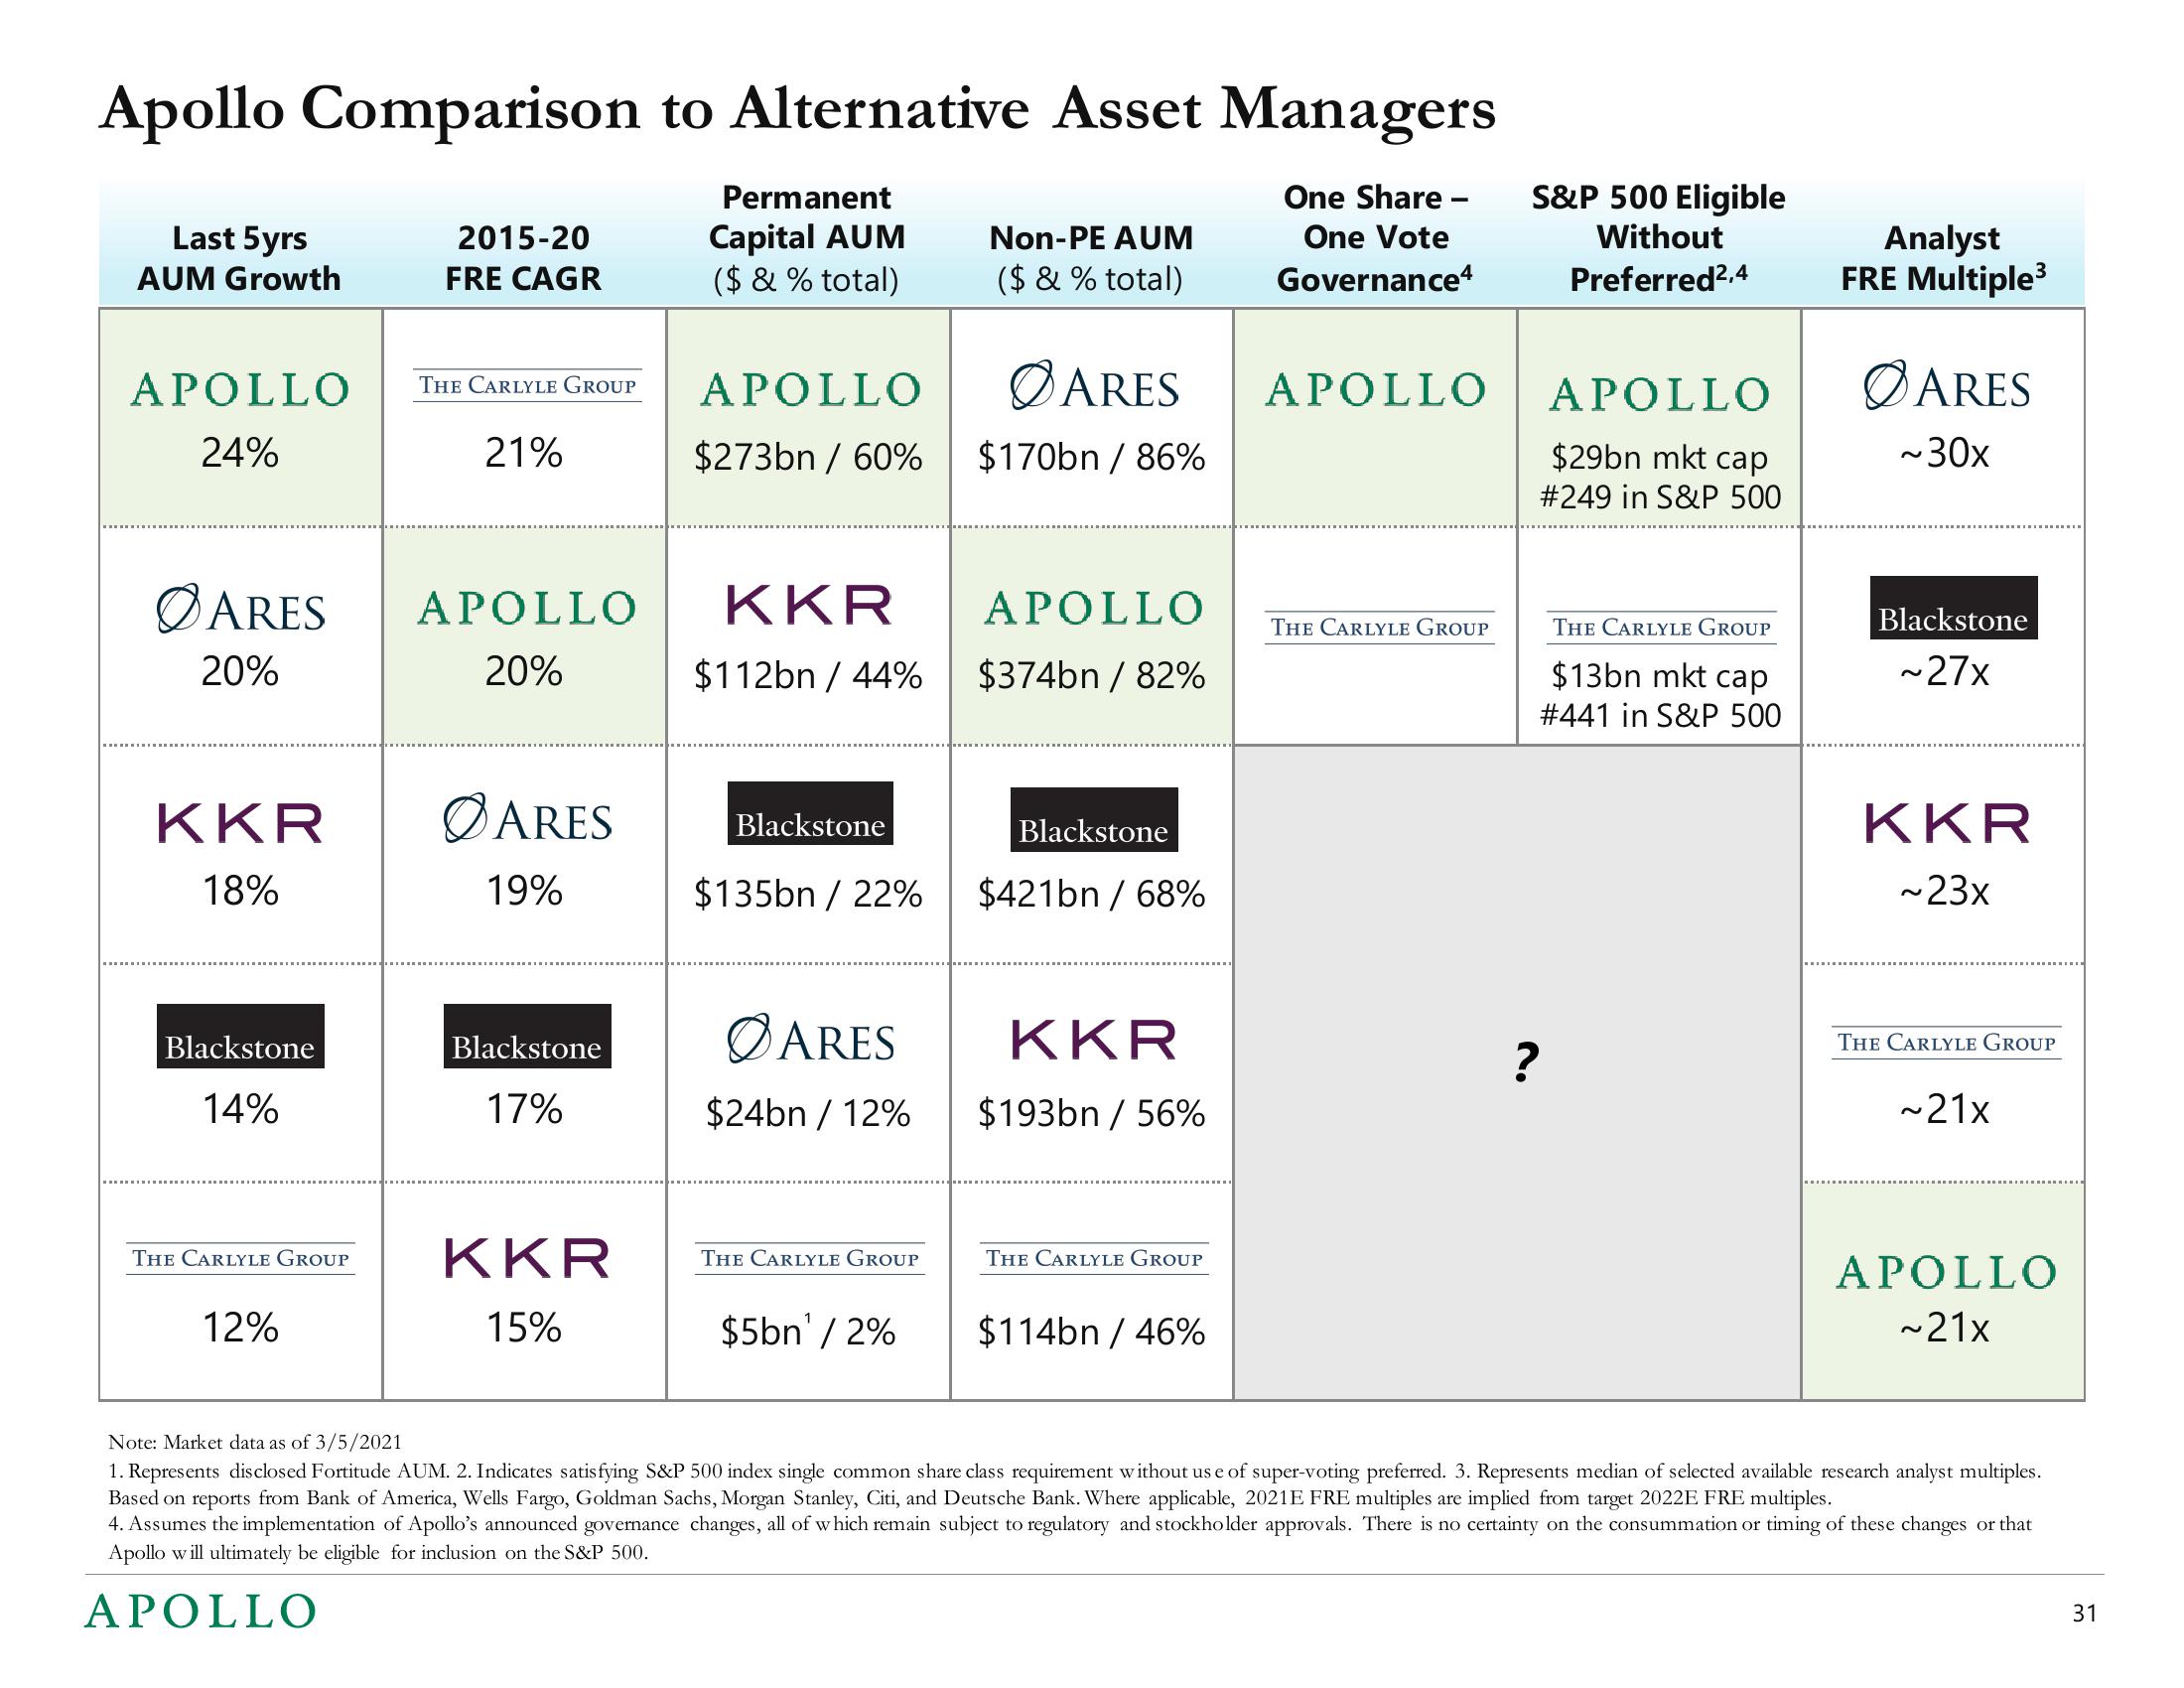
Apollo Comparison to Alternative Asset Managers
One Share -
One Vote
Governance4
Last 5yrs
AUM Growth
APOLLO
24%
ARES
20%
KKR
18%
Blackstone
14%
THE CARLYLE GROUP
12%
2015-20
FRE CAGR
THE CARLYLE GROUP
21%
APOLLO
20%
ARES
19%
Blackstone
17%
KKR
15%
Permanent
Capital AUM
($ & % total)
APOLLO
$273bn / 60%
KKR
$112bn / 44%
Blackstone
$135bn / 22%
ARES
$24bn / 12%
THE CARLYLE GROUP
$5bn¹ / 2%
Non-PE AUM
($ & % total)
ØARES
$170bn / 86%
APOLLO
$374bn / 82%
Blackstone
$421bn / 68%
KKR
$193bn / 56%
THE CARLYLE GROUP
$114bn / 46%
APOLLO
THE CARLYLE GROUP
S&P 500 Eligible
Without
Preferred²,4
?
APOLLO
$29bn mkt cap
# 249 in S&P 500
THE CARLYLE GROUP
$13bn mkt cap
# 441 in S&P 500
Analyst
FRE Multiple³
ARES
~30x
Blackstone
~27x
KKR
~23x
THE CARLYLE GROUP
~21x
APOLLO
~21x
Note: Market data as of 3/5/2021
1. Represents disclosed Fortitude AUM. 2. Indicates satisfying S&P 500 index single common share class requirement without us e of super-voting preferred. 3. Represents median of selected available research analyst multiples.
Based on reports from Bank of America, Wells Fargo, Goldman Sachs, Morgan Stanley, Citi, and Deutsche Bank. Where applicable, 2021E FRE multiples are implied from target 2022E FRE multiples.
4. Assumes the implementation of Apollo's announced governance changes, all of which remain subject to regulatory and stockholder approvals. There is no certainty on the consummation or timing of these changes or that
Apollo will ultimately be eligible for inclusion on the S&P 500.
APOLLO
31View entire presentation