Ashtead Group Results Presentation Deck
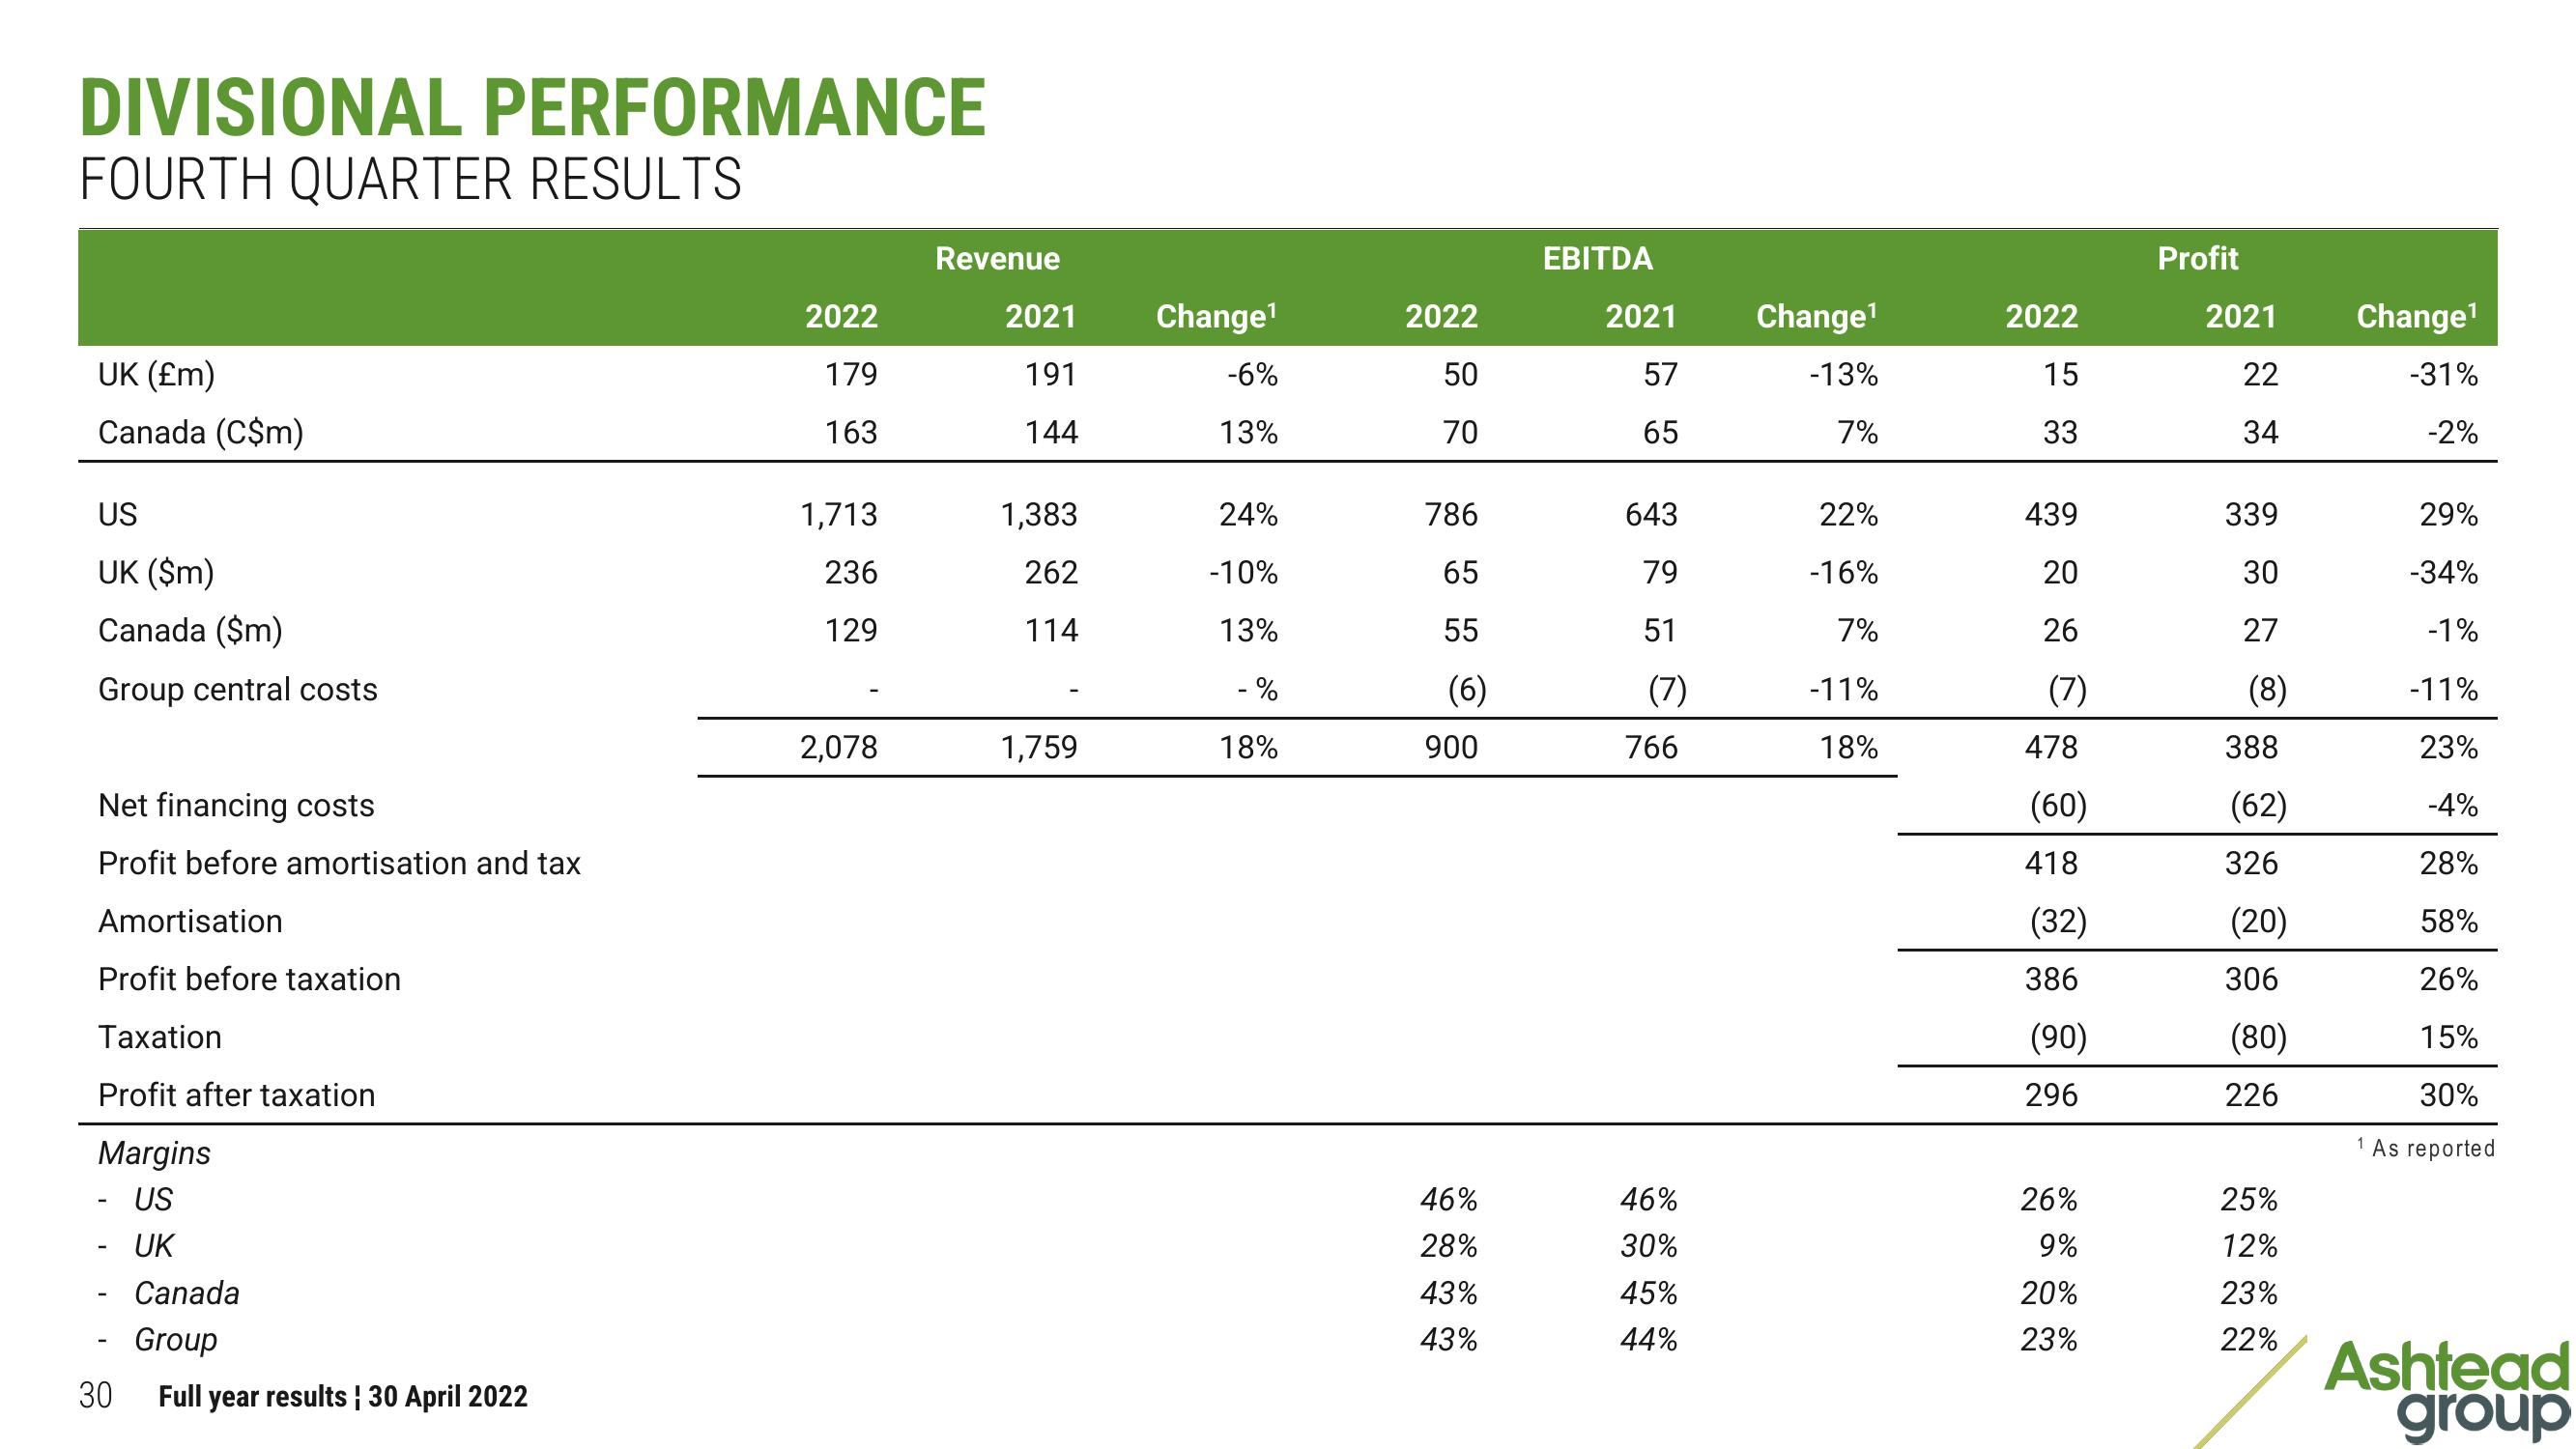
DIVISIONAL PERFORMANCE
FOURTH QUARTER RESULTS
UK (£m)
Canada (C$m)
US
UK ($m)
Canada ($m)
Group central costs
Net financing costs
Profit before amortisation and tax
Amortisation
Profit before taxation
Taxation
Profit after taxation
Margins
US
- UK
30
Canada
Group
Full year results | 30 April 2022
2022
179
163
1,713
236
129
2,078
Revenue
2021
191
144
1,383
262
114
1,759
Change¹
-6%
13%
24%
-10%
13%
- %
18%
2022
50
70
786
65
55
(6)
900
46%
28%
43%
43%
EBITDA
2021
57
65
643
79
51
(7)
766
46%
30%
45%
44%
Change¹
-13%
7%
22%
-16%
7%
-11%
18%
2022
15
33
439
20
26
(7)
478
(60)
418
(32)
386
(90)
296
26%
9%
20%
23%
Profit
2021
22
34
339
30
27
(8)
388
(62)
326
(20)
306
(80)
226
25%
12%
23%
22%
Change¹
-31%
-2%
29%
-34%
-1%
-11%
23%
-4%
28%
58%
26%
15%
30%
1 As reported
Ashtead
groupView entire presentation