Bird Investor Presentation Deck
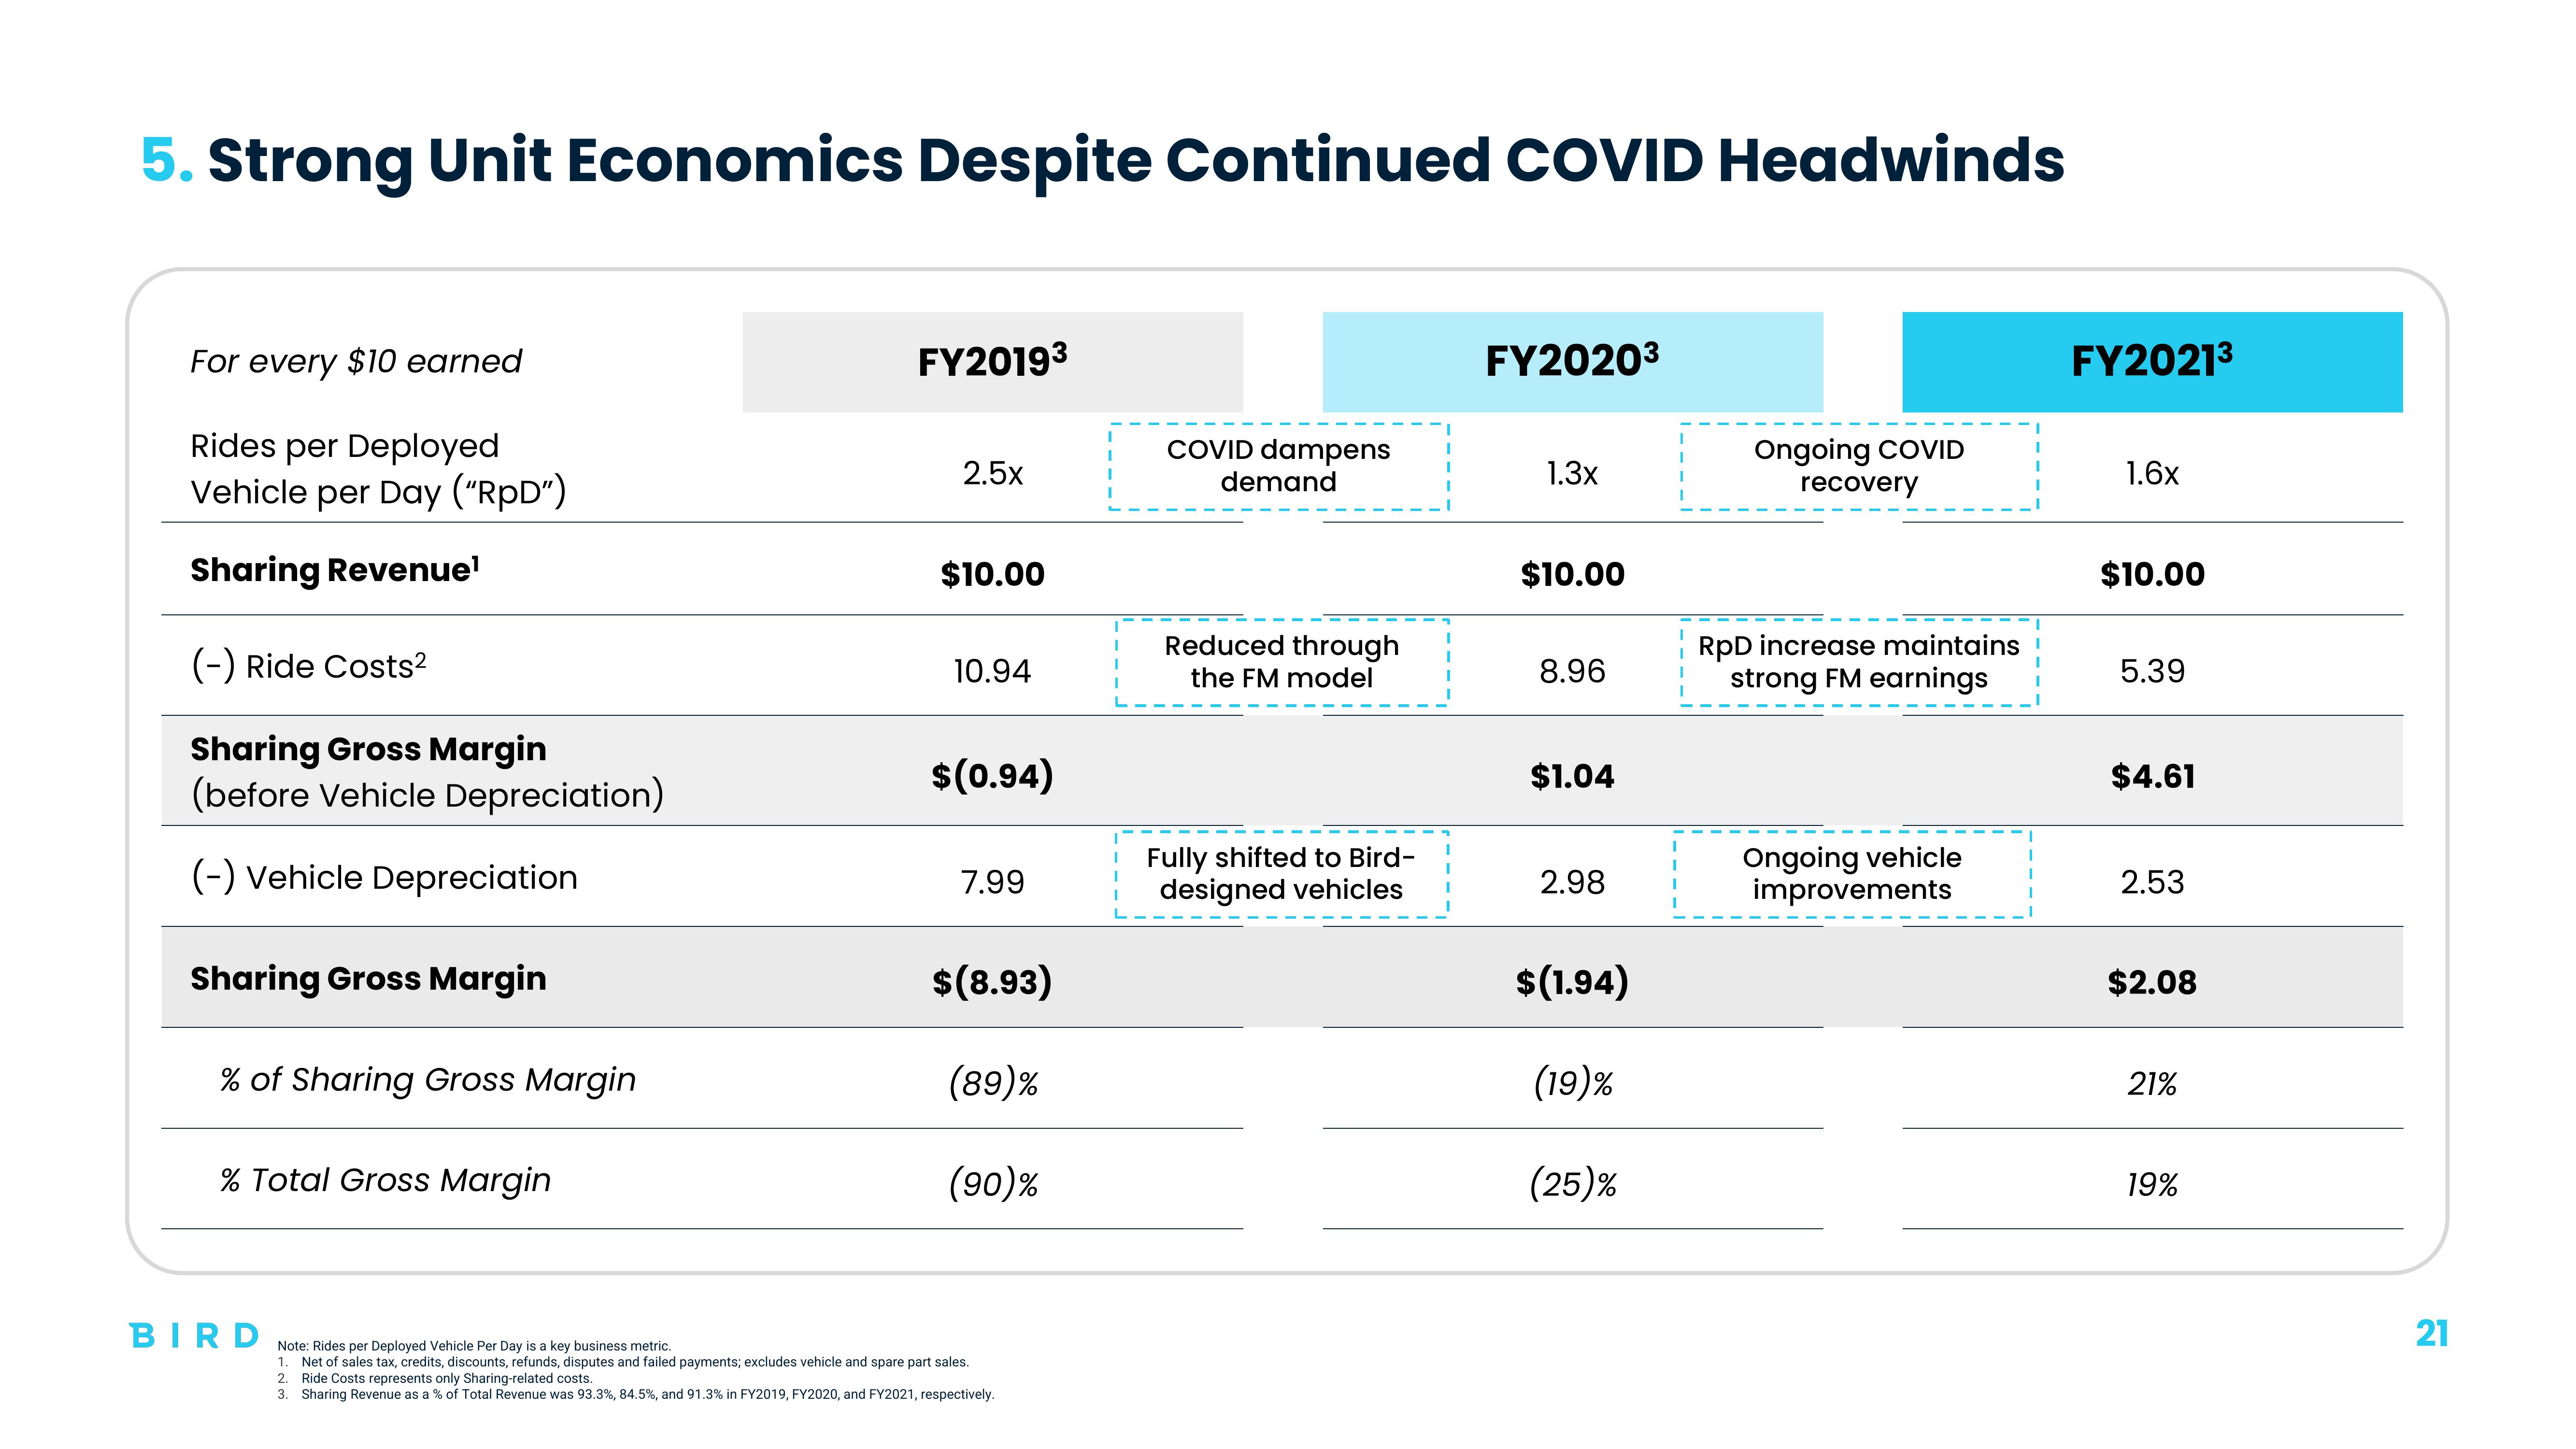
5. Strong Unit Economics Despite Continued COVID Headwinds
For every $10 earned
Rides per Deployed
Vehicle per Day ("RpD")
Sharing Revenue¹
(-) Ride Costs²
Sharing Gross Margin
(before Vehicle Depreciation)
(-) Vehicle Depreciation
Sharing Gross Margin
% of Sharing Gross Margin
% Total Gross Margin
BIRD
FY20193
2.5x
$10.00
10.94
$(0.94)
7.99
$(8.93)
(89)%
(90)%
Note: Rides per Deployed Vehicle Per Day is a key business metric.
1. Net of sales tax, credits, discounts, refunds, disputes and failed payments; excludes vehicle and spare part sales.
2. Ride Costs represents only Sharing-related costs.
3. Sharing Revenue as a % of Total Revenue was 93.3%, 84.5%, and 91.3% in FY2019, FY2020, and FY2021, respectively.
COVID dampens
demand
Reduced through
the FM model
Fully shifted to Bird-
designed vehicles
FY2020³
1.3x
$10.00
8.96
$1.04
2.98
$(1.94)
(19)%
(25)%
Ongoing COVID
recovery
RpD increase maintains
strong FM earnings
Ongoing vehicle
improvements
FY2021³
1.6x
$10.00
5.39
$4.61
2.53
$2.08
21%
19%
21View entire presentation