JD Sports Results Presentation Deck
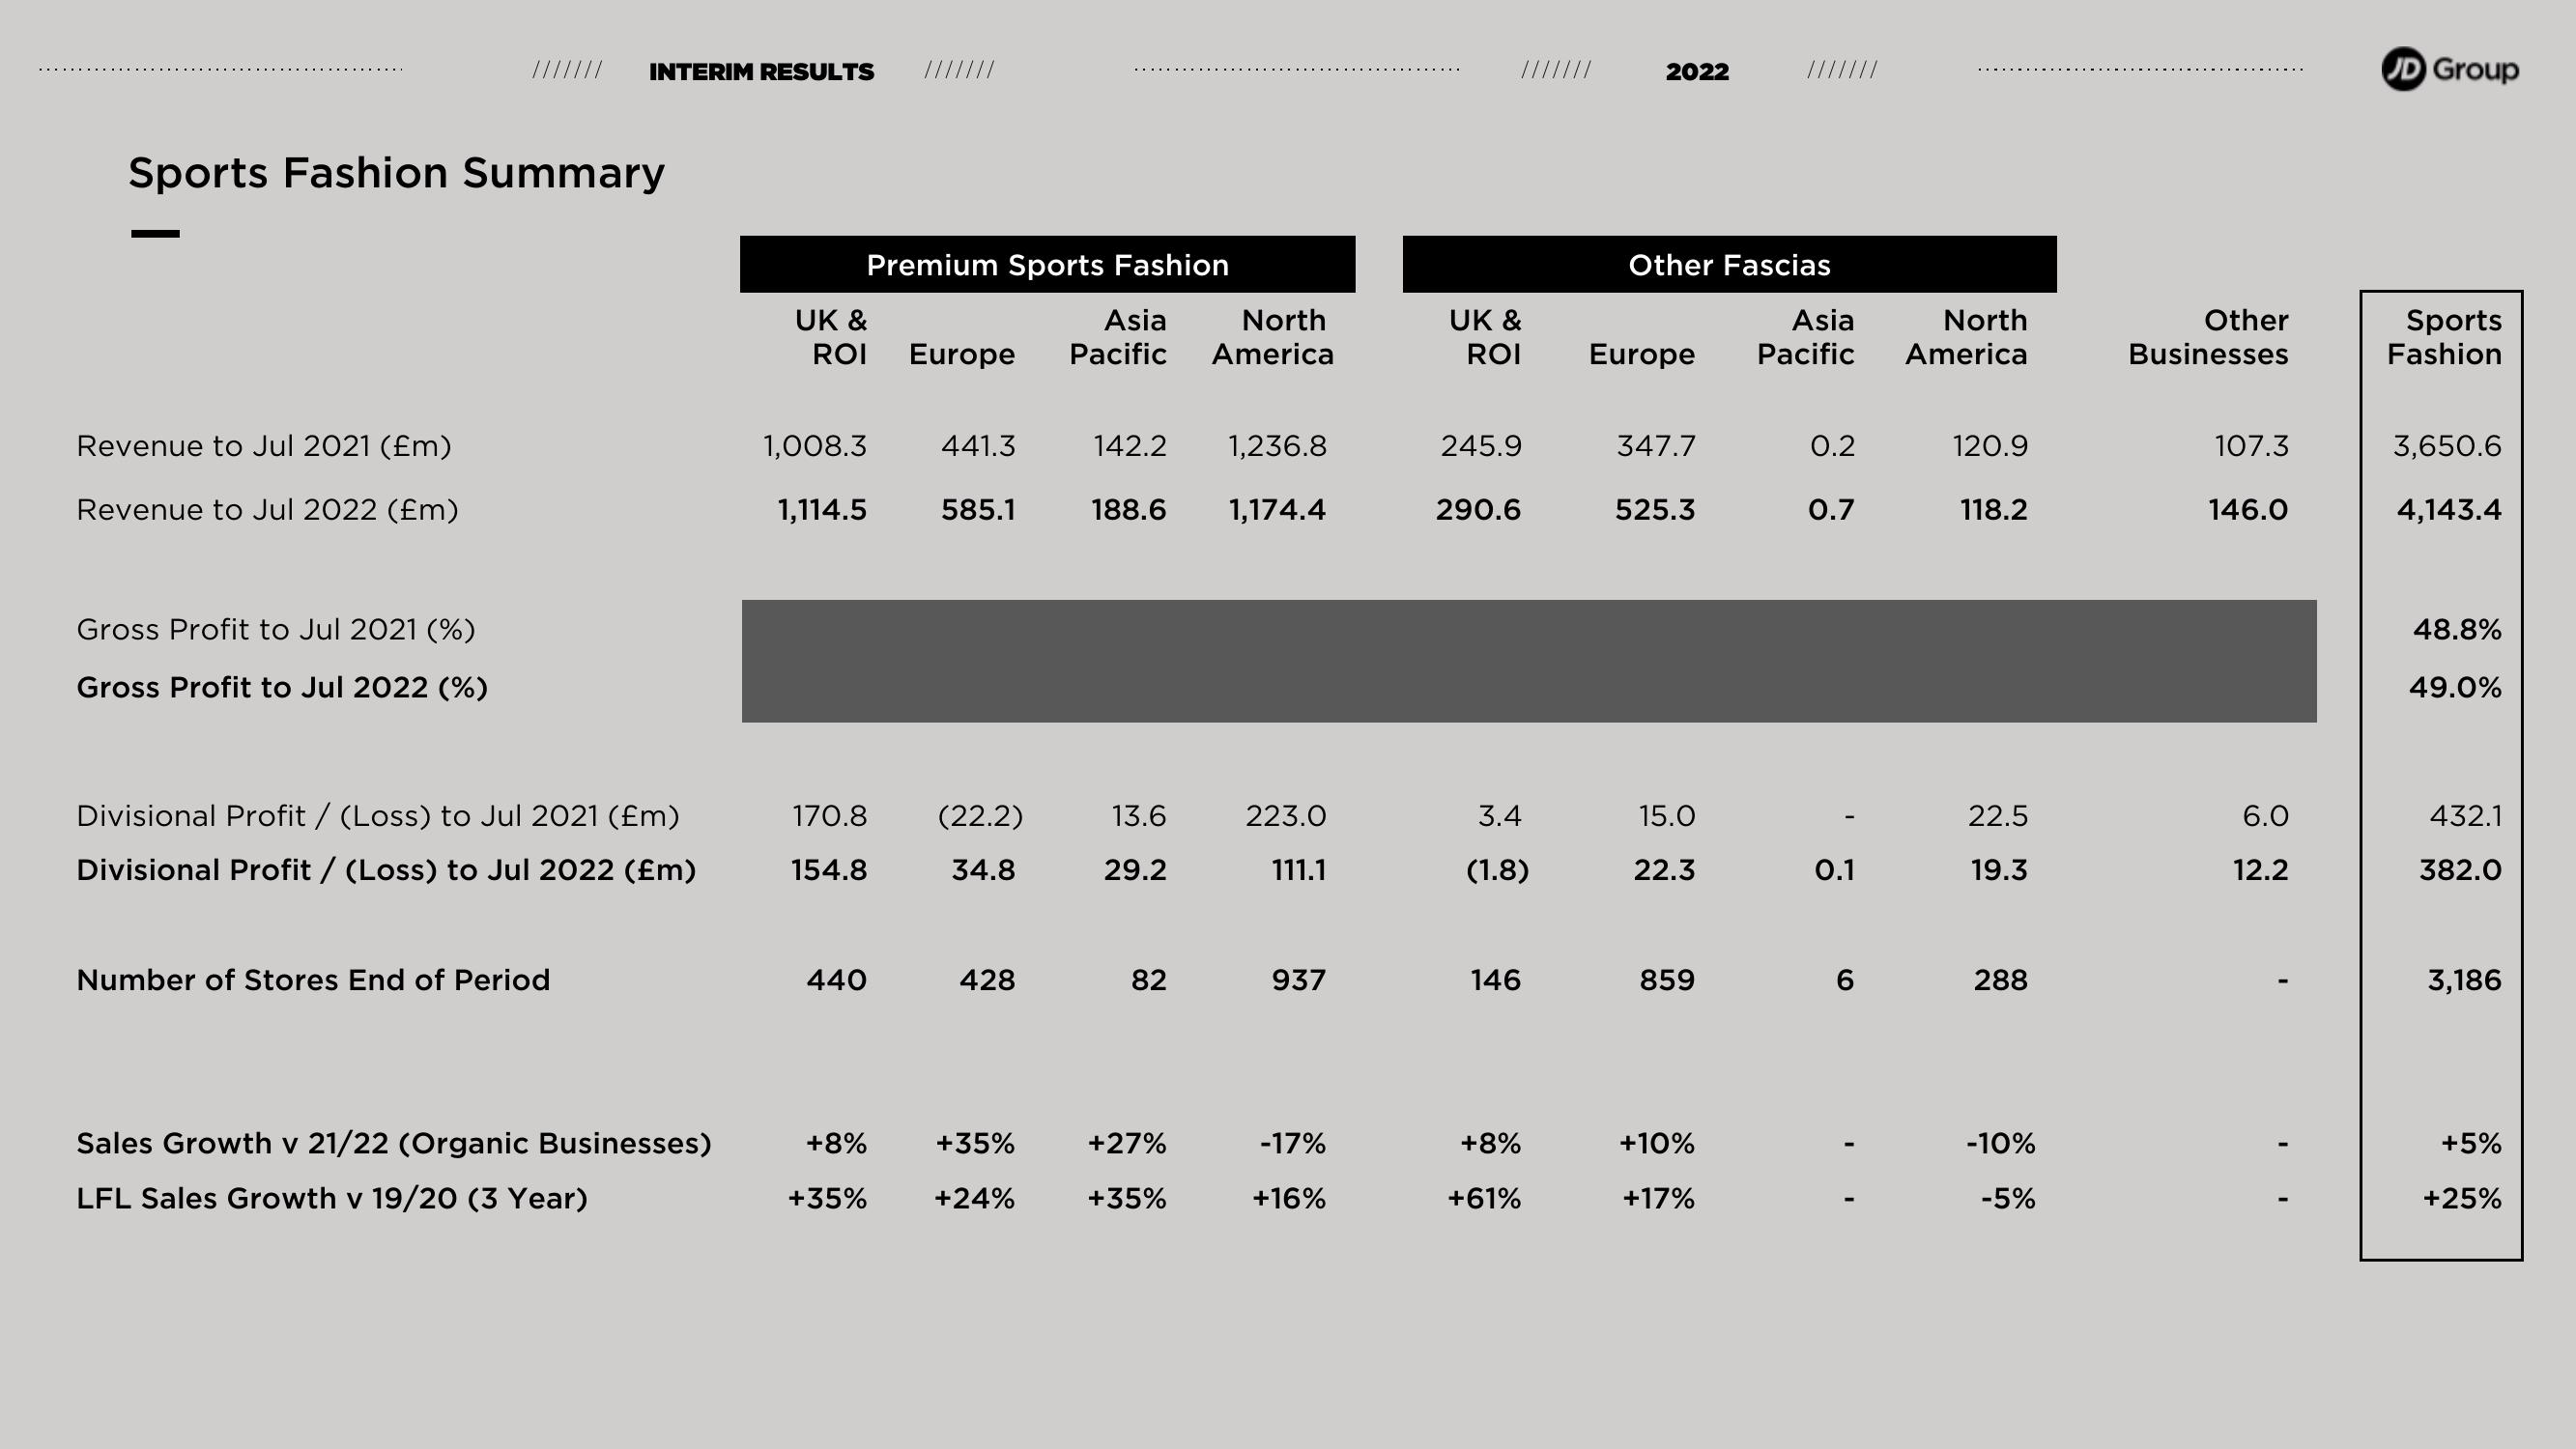
Sports Fashion Summary
Revenue to Jul 2021 (£m)
Revenue to Jul 2022 (Em)
Gross Profit to Jul 2021 (%)
Gross Profit to Jul 2022 (%)
INTERIM RESULTS ///////
Divisional Profit / (Loss) to Jul 2021 (Em)
Divisional Profit/ (Loss) to Jul 2022 (£m)
Number of Stores End of Period
Sales Growth v 21/22 (Organic Businesses)
LFL Sales Growth v 19/20 (3 Year)
Premium Sports Fashion
UK &
ROI
1,008.3
1,114.5
440
Asia North
Europe Pacific America
+8%
+35%
441.3
170.8 (22.2)
154.8
34.8
585.1
428
+35%
+24%
142.2
188.6
13.6
29.2
82
+27%
+35%
1,236.8
1,174.4
223.0
111.1
937
-17%
+16%
///////
UK &
ROI
245.9
290.6
3.4
(1.8)
146
+8%
+61%
2022
Other Fascias
Asia
Europe Pacific
347.7
525.3
15.0
22.3
859
+10%
+17%
0.2
0.7
0.1
6
North
America
120.9
118.2
22.5
19.3
288
-10%
-5%
Other
Businesses
107.3
146.0
6.0
12.2
JD Group
Sports
Fashion
3,650.6
4,143.4
48.8%
49.0%
432.1
382.0
3,186
+5%
+25%View entire presentation