dLocal Results Presentation Deck slide image

dLocal Results Presentation Deck

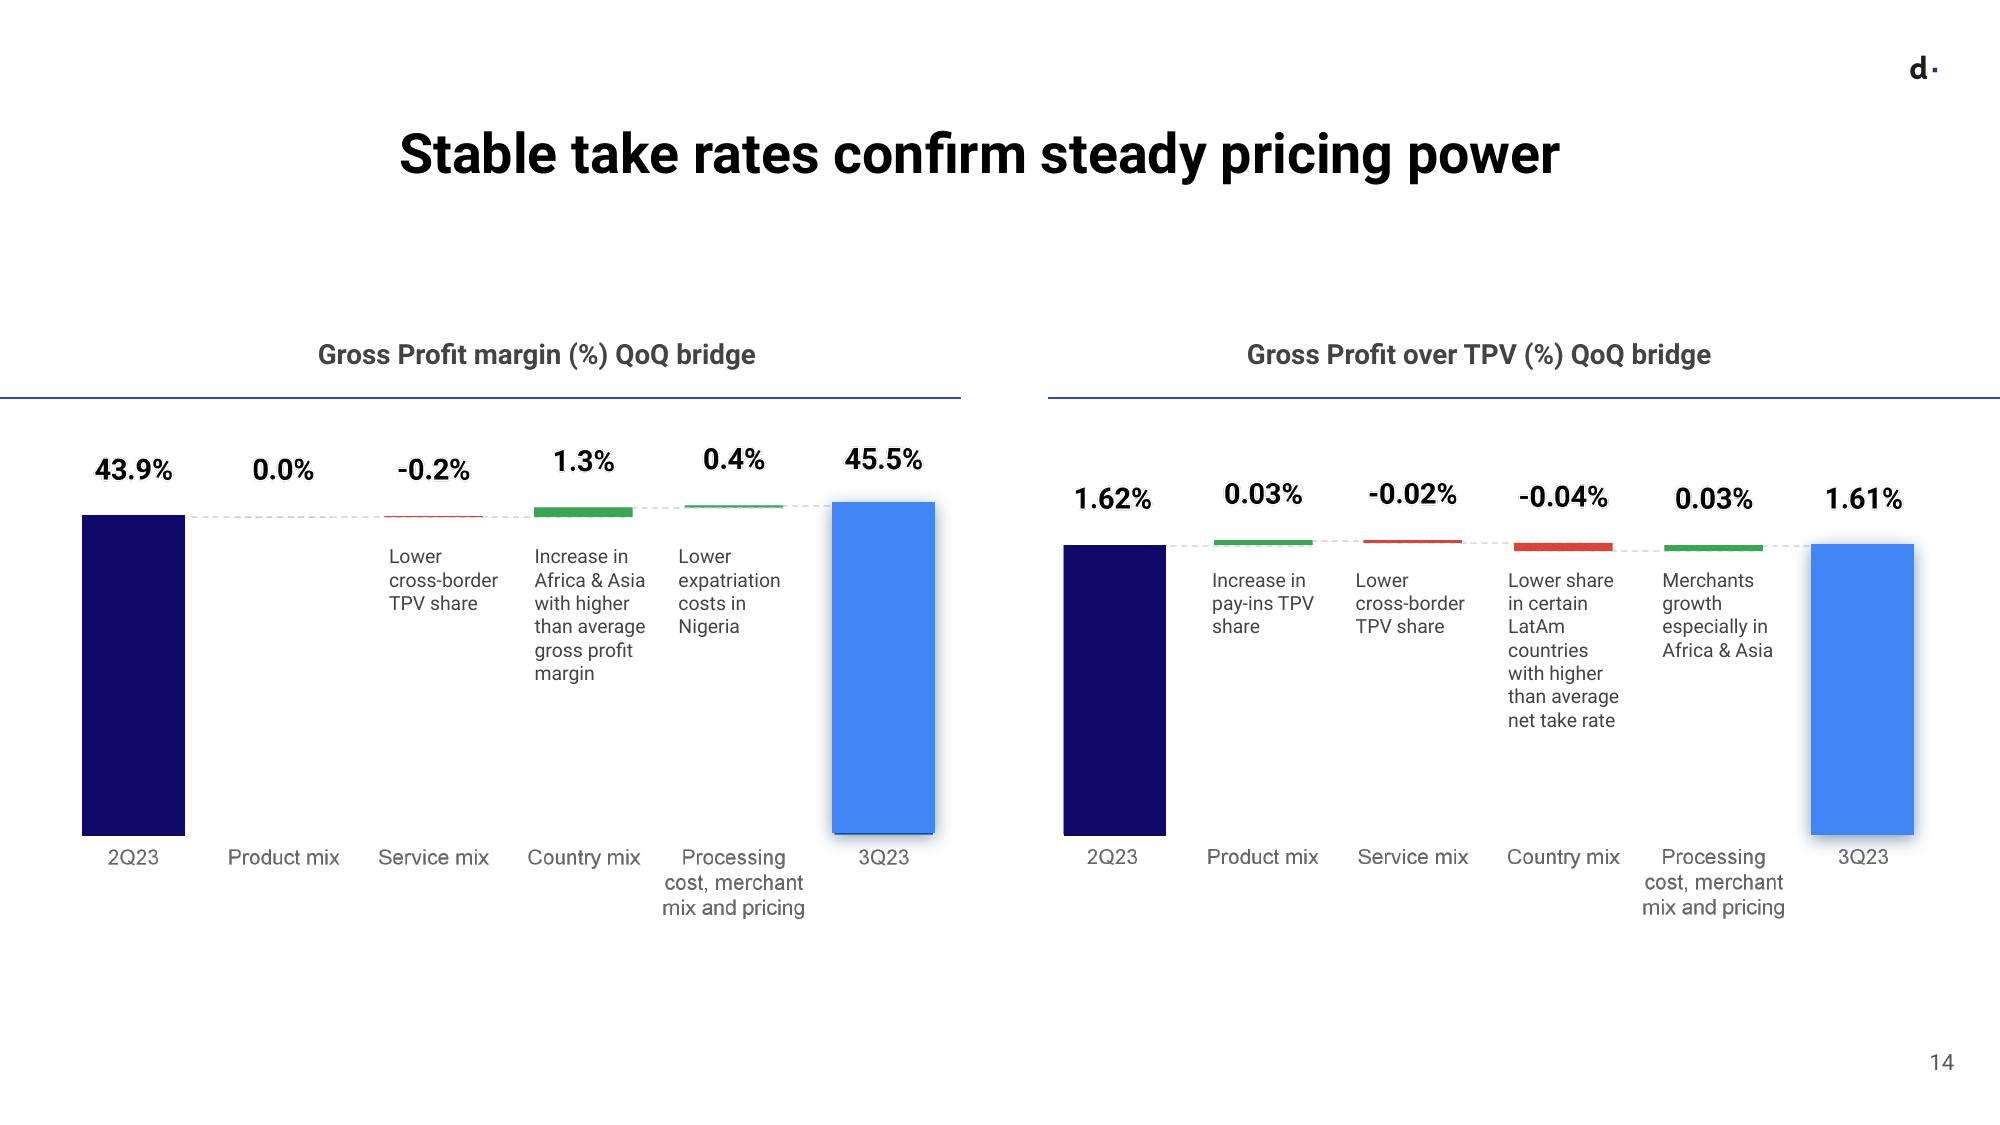
43.9% 2Q23 0.0% Stable take rates confirm steady pricing power Gross Profit margin (%) QoQ bridge Product mix -0.2% Lower cross-border TPV share Service mix 1.3% Increase in Africa & Asia with higher than average gross profit margin Country mix 0.4% Lower expatriation costs in Nigeria Processing cost, merchant mix and pricing 45.5% 3Q23 1.62% 2Q23 Gross Profit over TPV (%) QoQ bridge 0.03% Increase in pay-ins TPV share Product mix -0.02% Lower cross-border TPV share Service mix -0.04% Lower share in certain LatAm countries with higher than average net take rate Country mix 0.03% Merchants growth especially in Africa & Asia Processing cost, merchant mix and pricing 1.61% 3Q23 d. 14
View entire presentation