WeWork Results Presentation Deck
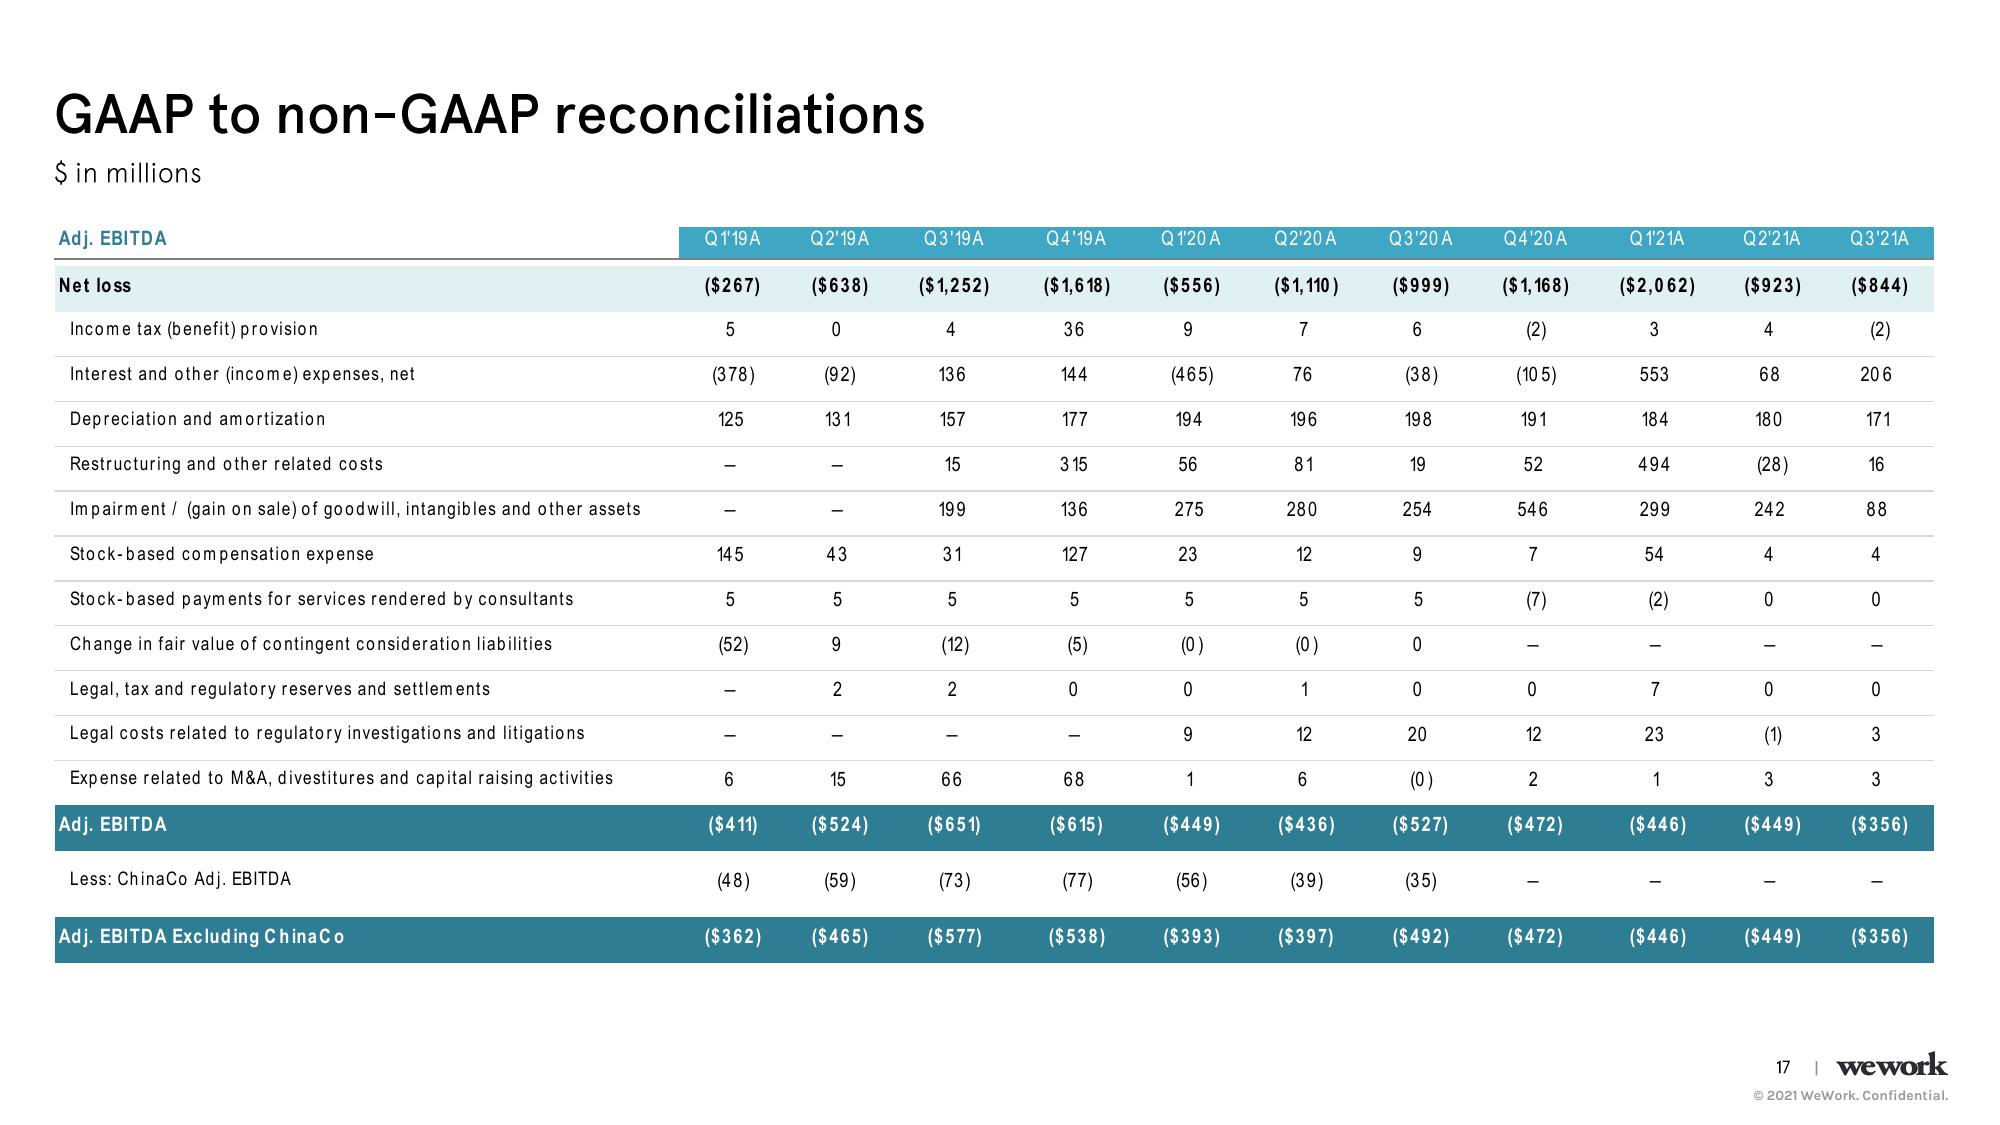
GAAP to non-GAAP reconciliations
$ in millions
Adj. EBITDA
Net loss
Income tax (benefit) provision
Interest and other (income) expenses, net
Depreciation and amortization
Restructuring and other related costs.
Impairment (gain on sale) of goodwill, intangibles and other assets
Stock-based compensation expense
Stock-based payments for services rendered by consultants
Change in fair value of contingent consideration liabilities
Legal, tax and regulatory reserves and settlements.
Legal costs related to regulatory investigations and litigations
Expense related to M&A, divestitures and capital raising activities
Adj. EBITDA
Less: China Co Adj. EBITDA
Adj. EBITDA Excluding China Co
Q1'19 A
($267)
5
(378)
125
145
5
(52)
6
($411)
(48)
($362)
Q2'19A
($638)
0
(92)
131
I
I
43
5
9
2
15
($524)
(59)
($465)
Q3'19A
($1,252)
4
136
157
15
199
31
5
(12)
2
66
($651)
(73)
($577)
Q4'19 A
($1,618)
36
144
177
315
136
127
5
(5)
0
68
($615)
(77)
($538)
Q 1'20 A
($556)
9
(465)
194
56
275
23
5
(0)
0
9
1
($449)
(56)
($393)
Q2'20 A
($ 1,110)
7
76
196
81
280
12
5
(0)
1
12
6
($436)
(39)
($397)
Q3'20 A
($999)
6
(38)
198
19
254
9
5
0
0
20
(0)
($527)
(35)
Q4'20 A
($ 1,168)
(2)
(105)
191
52
546
7
(7)
I
0
12
2
($472)
($492) ($472)
Q1'21A
($2,062)
3
553
184
494
299
54
(2)
7
23
1
($446)
($446)
Q2¹21A
($923)
st
4
68
180
(28)
242
4
0
0
(1)
3
($449)
($449)
Q3'21A
($844)
(2)
206
171
16
88
4
0
0
3
3
($356)
($356)
17 | wework
Ⓒ2021 WeWork. Confidential.View entire presentation