Grove SPAC Presentation Deck
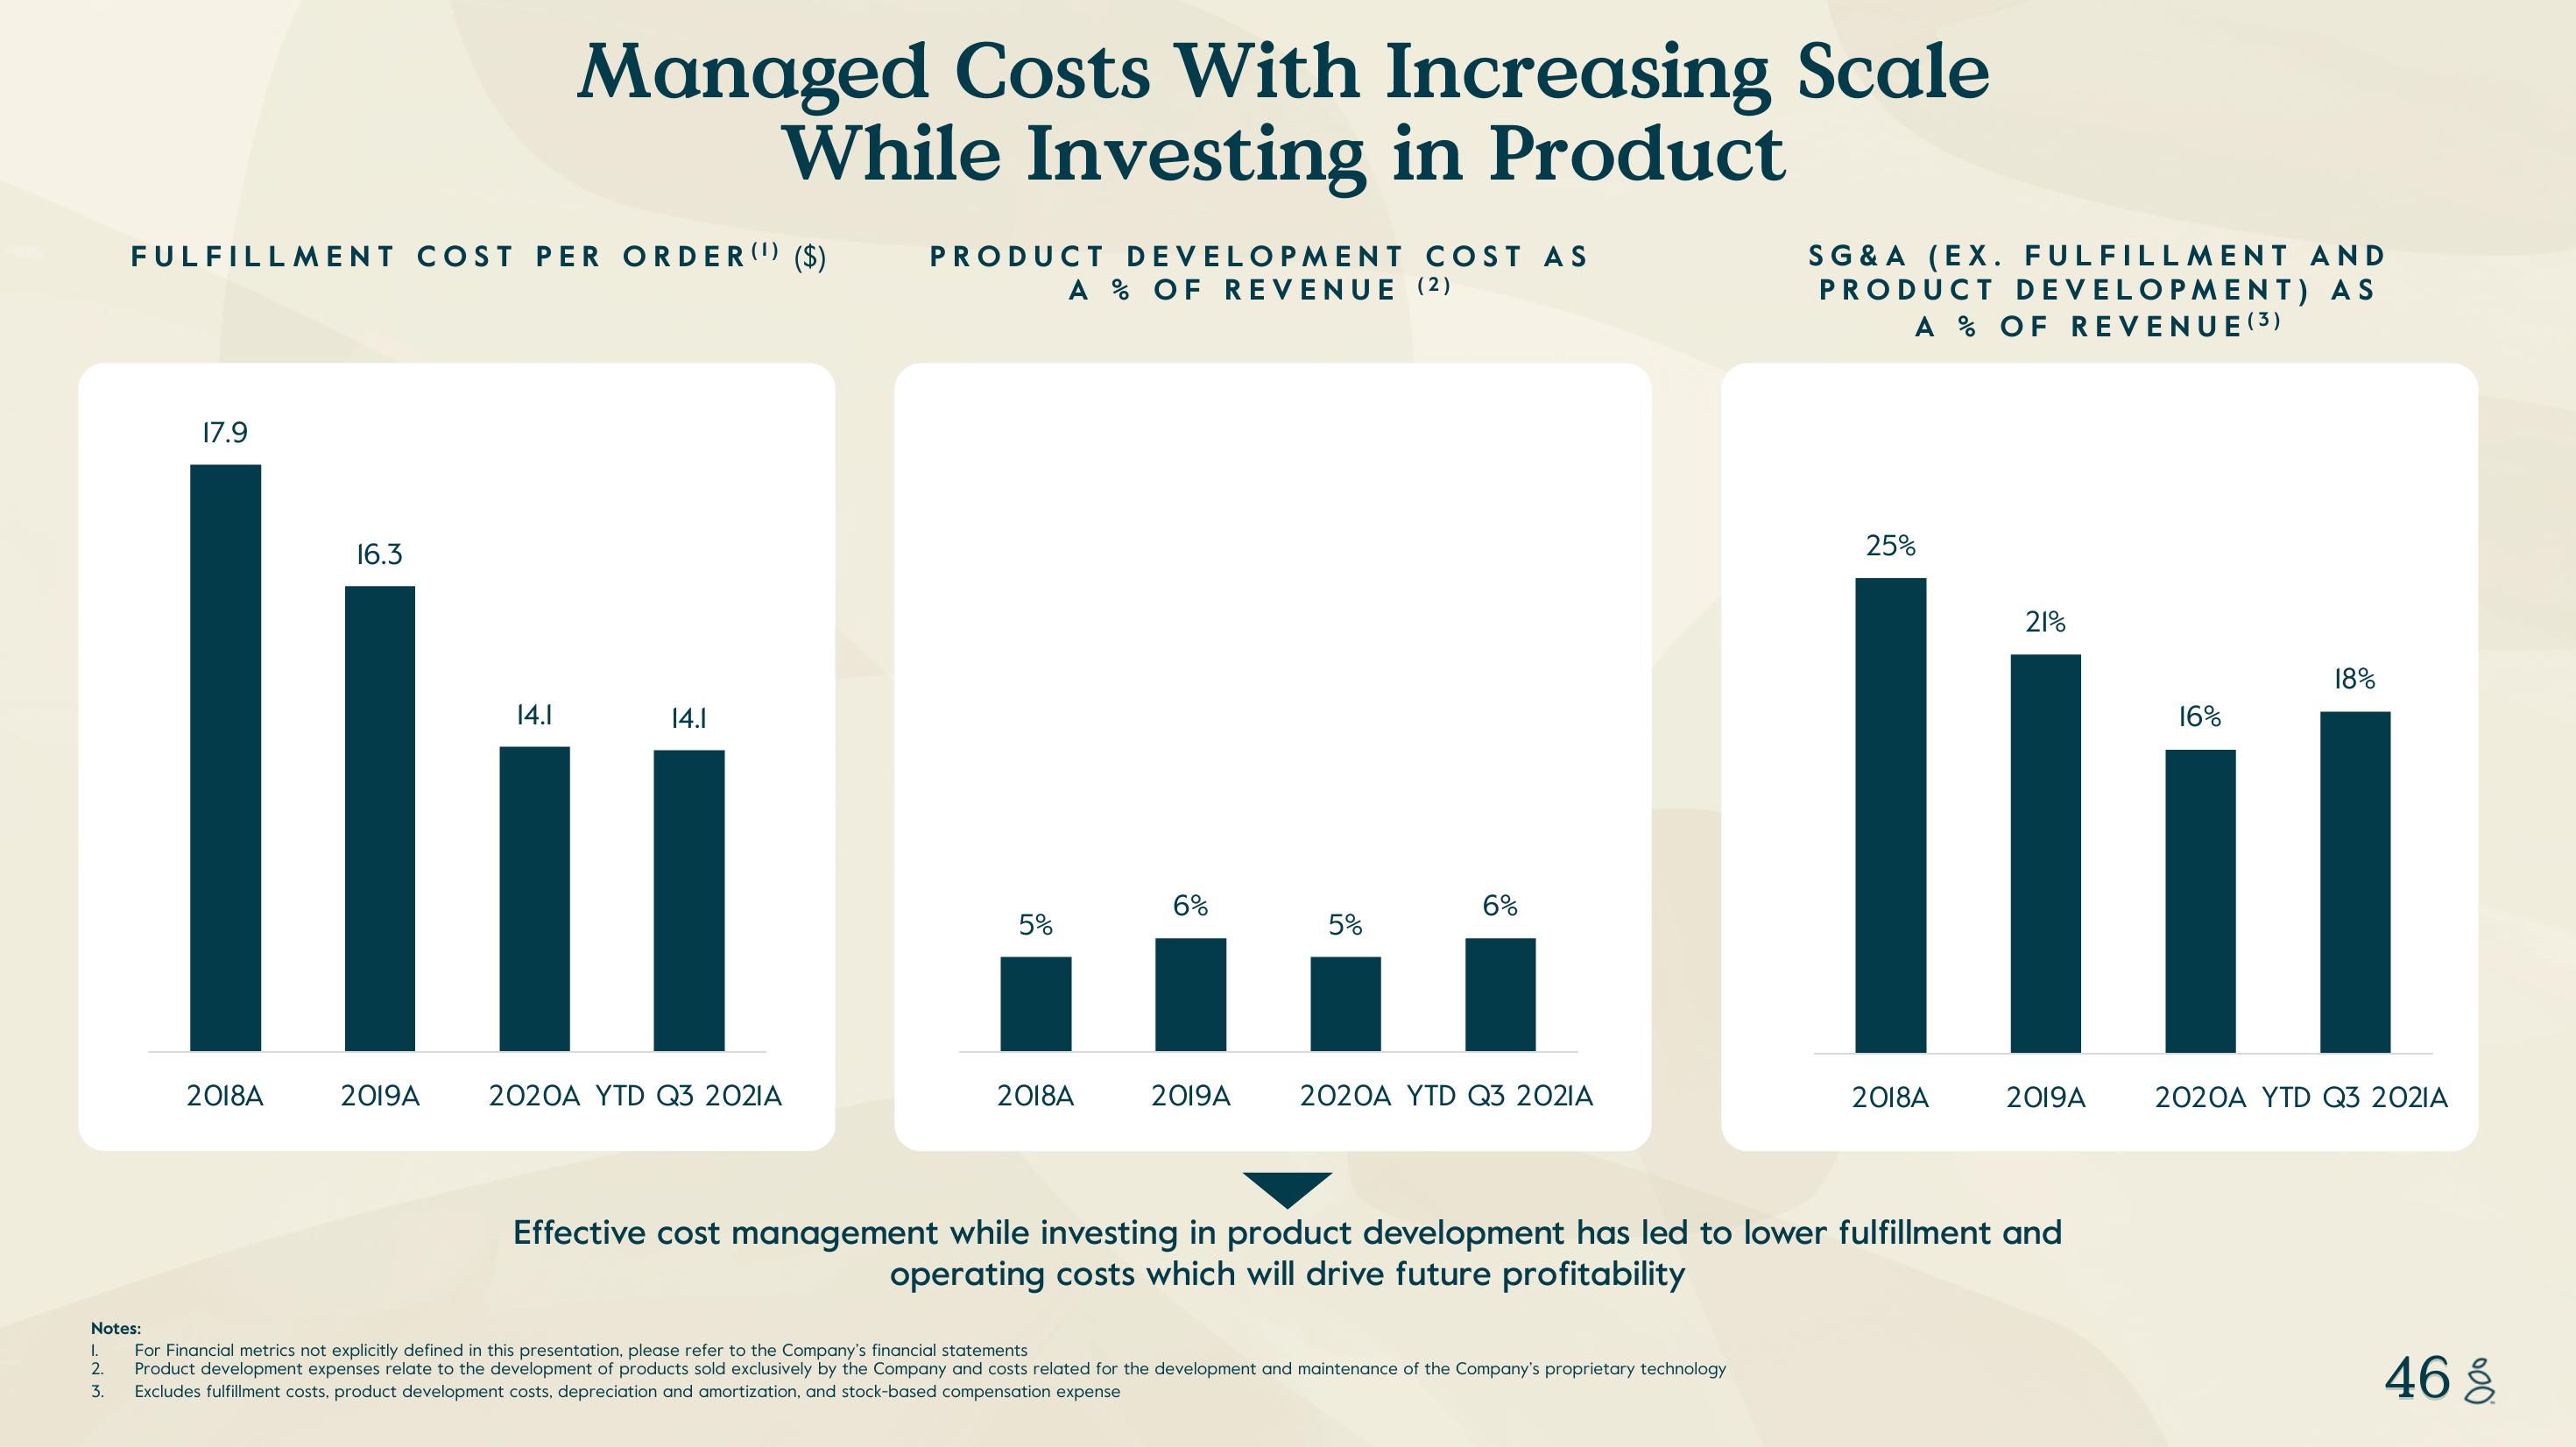
FULFILLMENT COST PER ORDER (¹) ($)
17.9
Managed Costs With Increasing Scale
While Investing in Product
16.3
14.1
14.1
I.
2018A
2019A
2020A YTD Q3 2021A
PRODUCT DEVELOPMENT COST AS
A % OF REVENUE (2)
5%
2018A
6%
2019A
5%
6%
2020A YTD Q3 2021A
SG&A (EX. FULFILLMENT AND
PRODUCT DEVELOPMENT) AS
A % OF REVENUE (3)
Notes:
I.
For Financial metrics not explicitly defined in this presentation, please refer to the Company's financial statements
2. Product development expenses relate to the development of products sold exclusively by the Company and costs related for the development and maintenance of the Company's proprietary technology
Excludes fulfillment costs, product development costs, depreciation and amortization, and stock-based compensation expense
3.
25%
21%
16%
Ili
2018A
2019A
Effective cost management while investing in product development has led to lower fulfillment and
operating costs which will drive future profitability
18%
2020A YTD Q3 2021A
46 8View entire presentation