Q4 2020 Investor Presentation
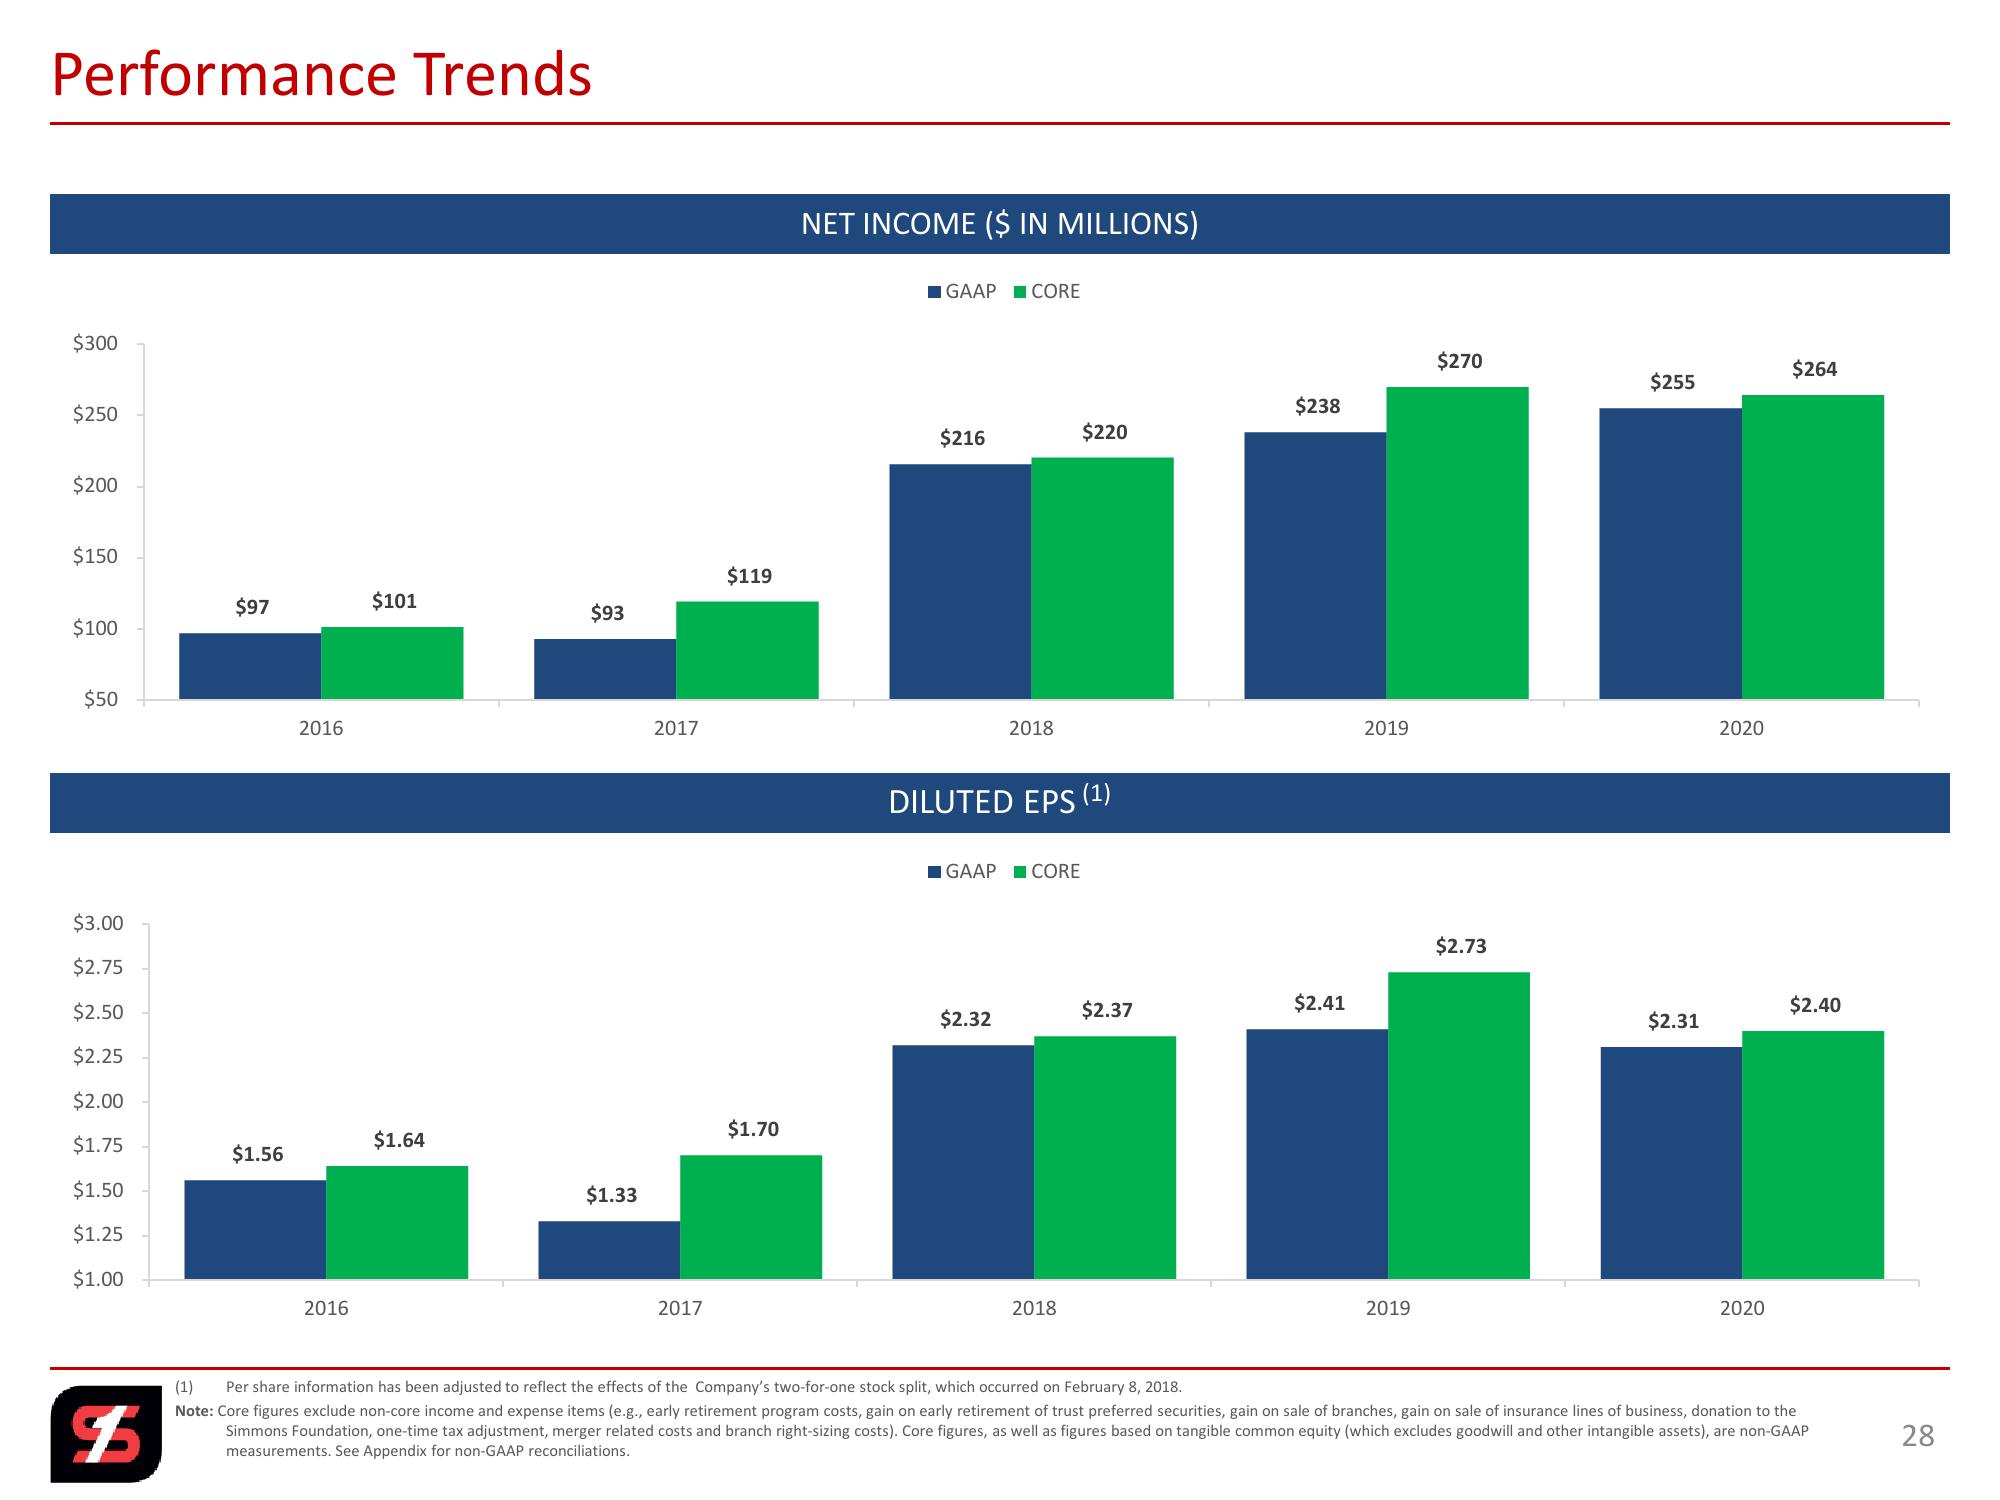
Performance Trends
$300
$250
$200
$150
$119
$97
$101
$93
$100
$50
2016
$3.00
$2.75
$2.50
$2.25
$2.00
$1.75
$1.64
$1.56
$1.50
$1.25
$1.00
$
2016
2017
$1.33
$1.70
2017
NET INCOME ($ IN MILLIONS)
GAAP CORE
$270
$264
$255
$238
$216
$220
2018
DILUTED EPS (1)
GAAP CORE
$2.32
$2.37
$2.41
2018
2019
2020
2019
$2.73
$2.40
$2.31
2020
(1) Per share information has been adjusted to reflect the effects of the Company's two-for-one stock split, which occurred on February 8, 2018.
Note: Core figures exclude non-core income and expense items (e.g., early retirement program costs, gain on early retirement of trust preferred securities, gain on sale of branches, gain on sale of insurance lines of business, donation to the
Simmons Foundation, one-time tax adjustment, merger related costs and branch right-sizing costs). Core figures, as well as figures based on tangible common equity (which excludes goodwill and other intangible assets), are non-GAAP
measurements. See Appendix for non-GAAP reconciliations.
28View entire presentation