Mister Car Wash Investor Presentation Deck
Strong Track Record of Growth
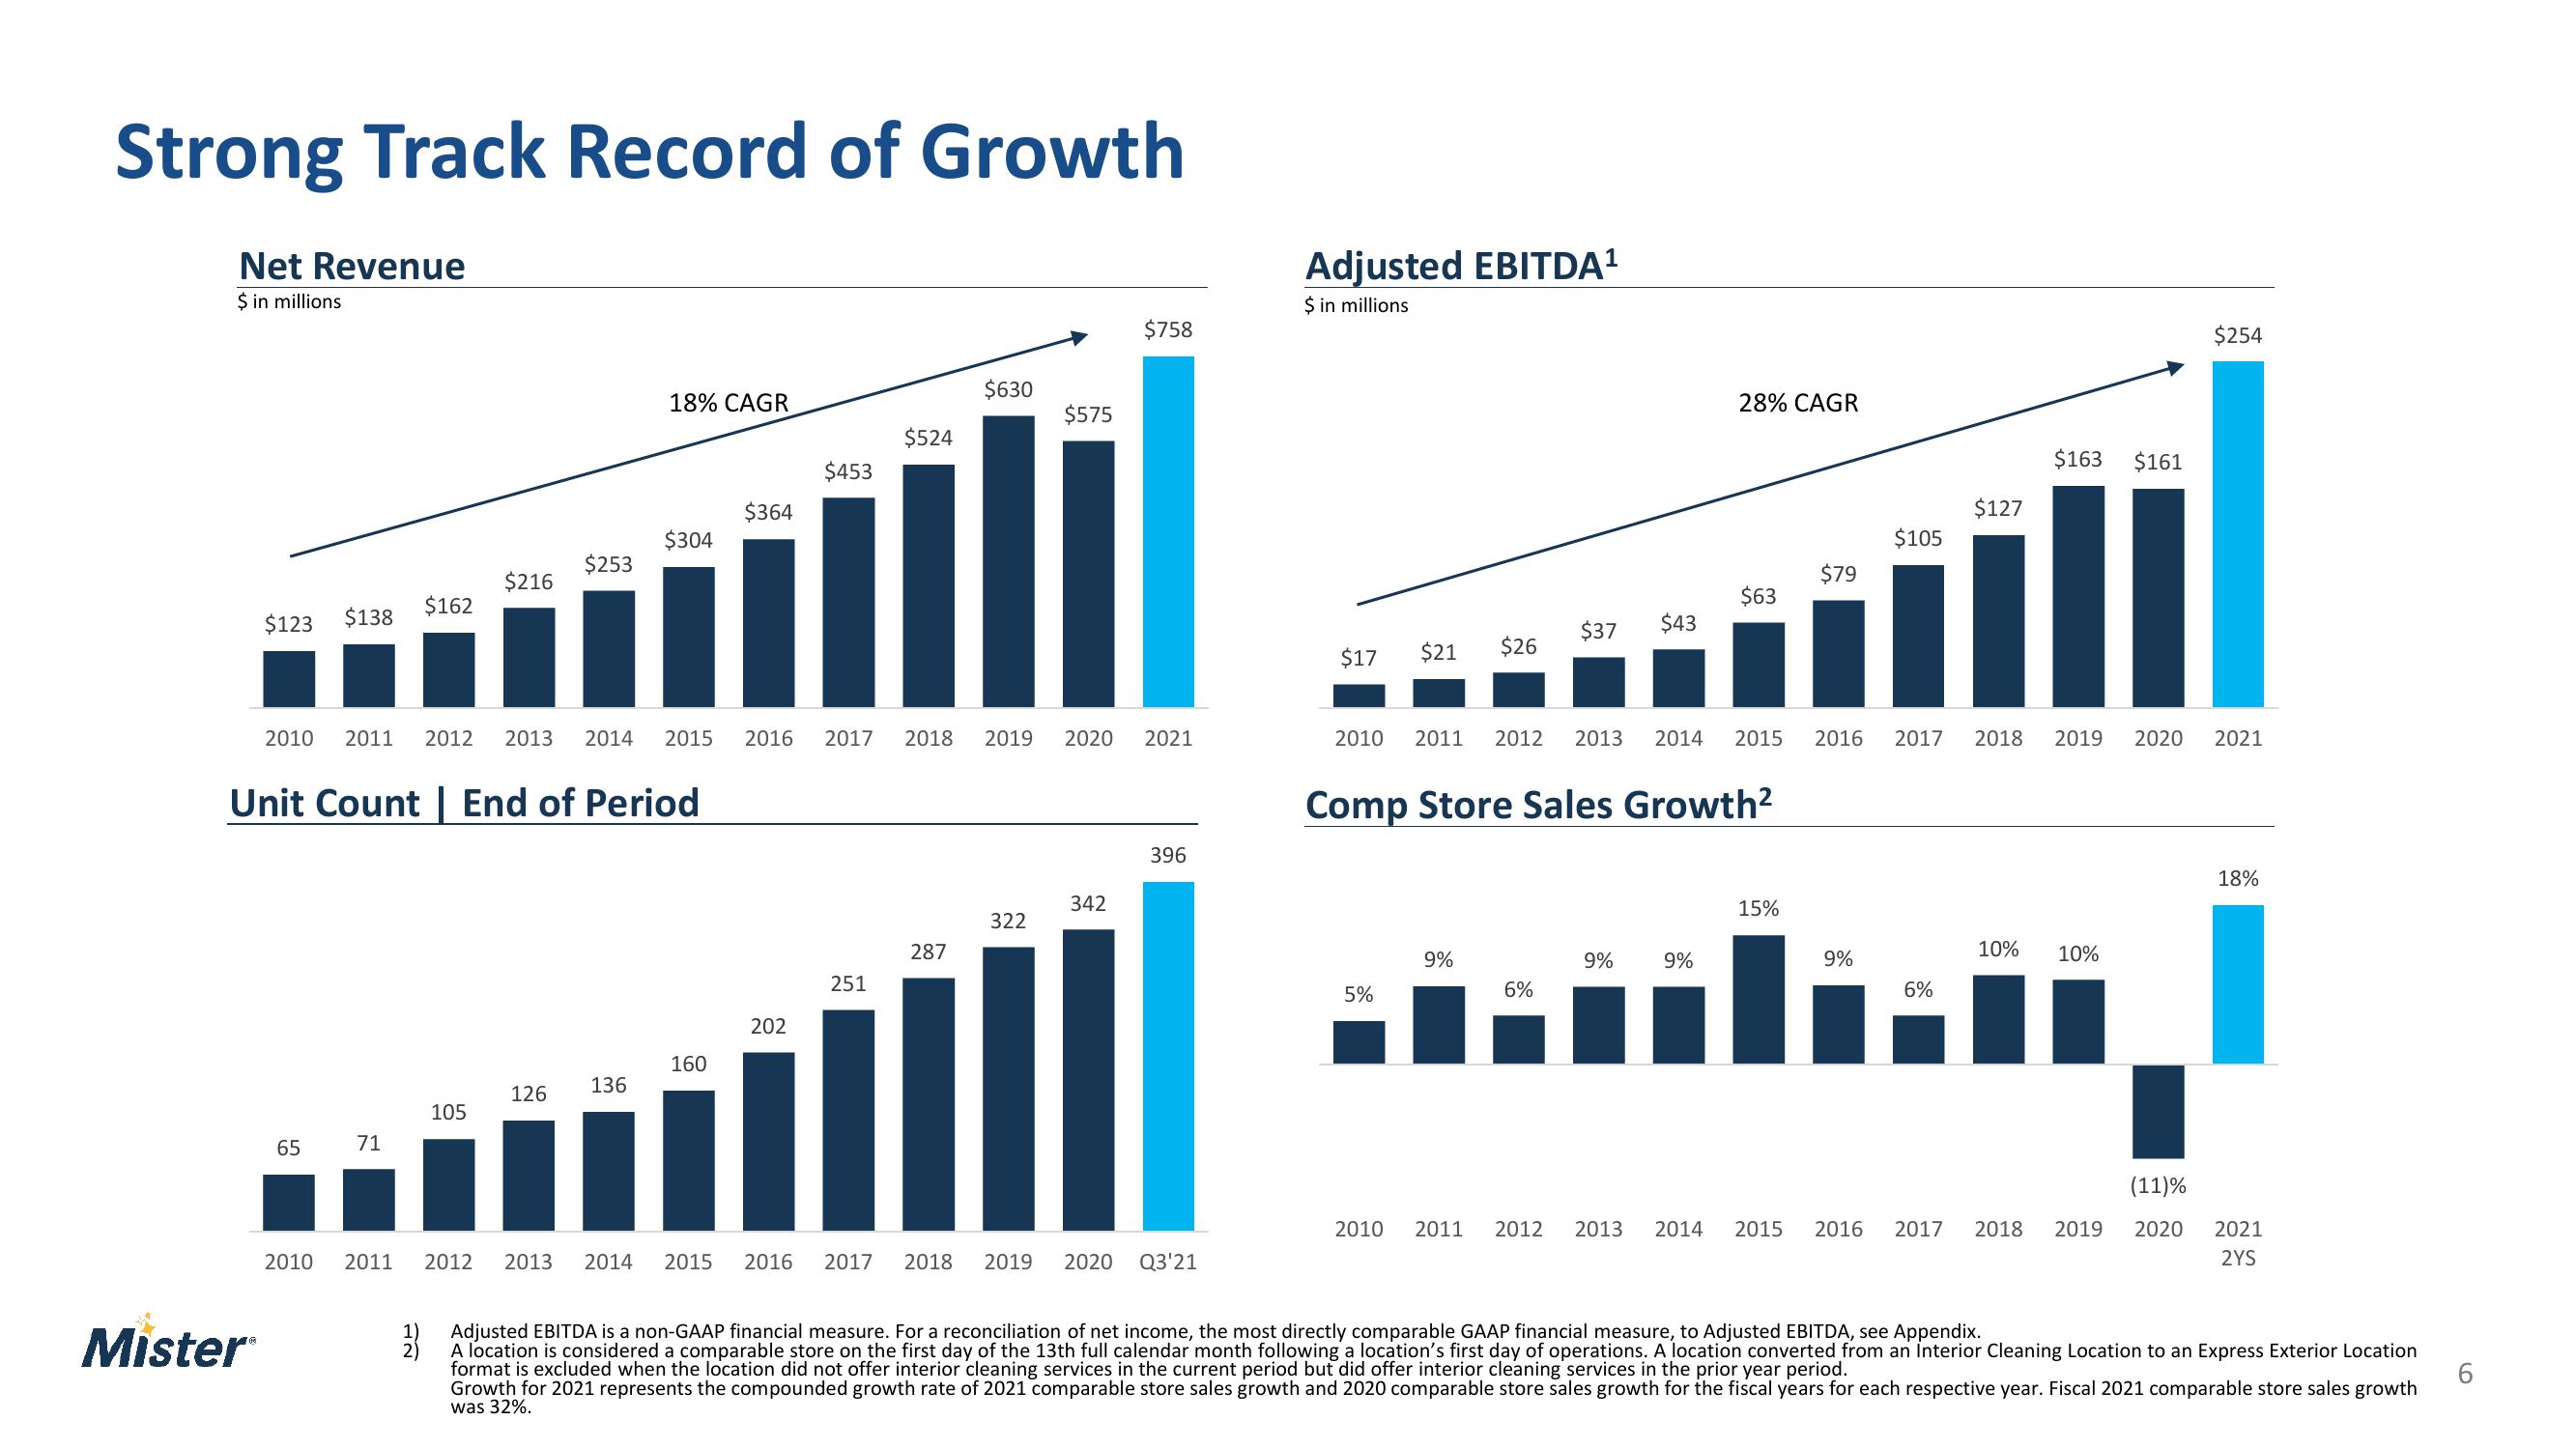
Net Revenue
$ in millions
$123 $138
Mister
$162
65
71
$216
$253
Unit Count | End of Period
105
18% CAGR
$304
160
$364
2010 2011 2012 2013 2014 2015 2016 2017 2018 2019 2020 2021
136
126
$453
202
$524
251
287
$630
2010 2011 2012 2013 2014 2015 2016 2017 2018
$575
322
$758
342
396
2019 2020 Q3'21
Adjusted EBITDA¹
$ in millions
$17 $21 $26
5%
$37 $43
2010 2011 2012 2013 2014 2015
9%
Comp Store Sales Growth²
6%
28% CAGR
9%
$63
9%
15%
$79
$105
9%
$127
6%
$163
2016 2017 2018 2019 2020 2021
10%
$161
10%
$254
(11)%
2010 2011 2012 2013 2014 2015 2016 2017 2018 2019 2020
18%
2021
2YS
Adjusted EBITDA is a non-GAAP financial measure. For a reconciliation of net income, the most directly comparable GAAP financial measure, to Adjusted EBITDA, see Appendix.
A location is considered a comparable store on the first day of the 13th full calendar month following a location's first day of operations. A location converted from an Interior Cleaning Location to an Express Exterior Location
format is excluded when the location did not offer interior cleaning services in the current period but did offer interior cleaning services in the prior year period.
Growth for 2021 represents the compounded growth rate of 2021 comparable store sales growth and 2020 comparable store sales growth for the fiscal years for each respective year. Fiscal 2021 comparable store sales growth
was 32%.
6View entire presentation