Covalto SPAC Presentation Deck
Powerful
Model
Generating
Profitable
Growth
Note: Please refer to "Disclaimer" on Slides 2-3 including under the
headers "Forward-Looking Statements", "Use of Projections",
"Preliminary Financial Information", "Pro Forma Financial Information"
and "Financial Information; Non-GAAP financial Measures" for the
disclaimer regarding the forecasts, projections and preliminary financial
information included in this presentation. 2021 financial information is
from preliminary estimated unaudited financial statements for 2021,
which are based on currently available information and subject to
completion of financial closing procedures and the audit. Actual 2021
financial information may differ materially from these preliminary
estimates pending completion of financial closing procedures and the
audit. Projected data based upon Management good faith targets and
are subject to significant risks.
1. Average historical exchange rate used for 2019-2021 figures. Fixed
exchange rate of $20 MXN/USD for projected figures; 2019-2020
financials exclude Banco Finterra.
4.
2. Financial information for the 2021 year is unaudited pro forma
financial information, giving effect to the Company's acquisition of
Banco Finterra as if it occurred on January 1, 2021. May not
indicative of actual or future results.
3. Operating Expense in 2022E includes one-time restructuring cost
and non-recurring expenses
Net of Covalto's funding costs, total operating expenses and stock
options vesting plan; margin based on Net Revenue. Pre-Tax Income
is a non-GAAP measure.
5. Total portfolio represents gross receivable balance across business
loans, business leases, trade finance, embedded finance, and credit
cards.
31
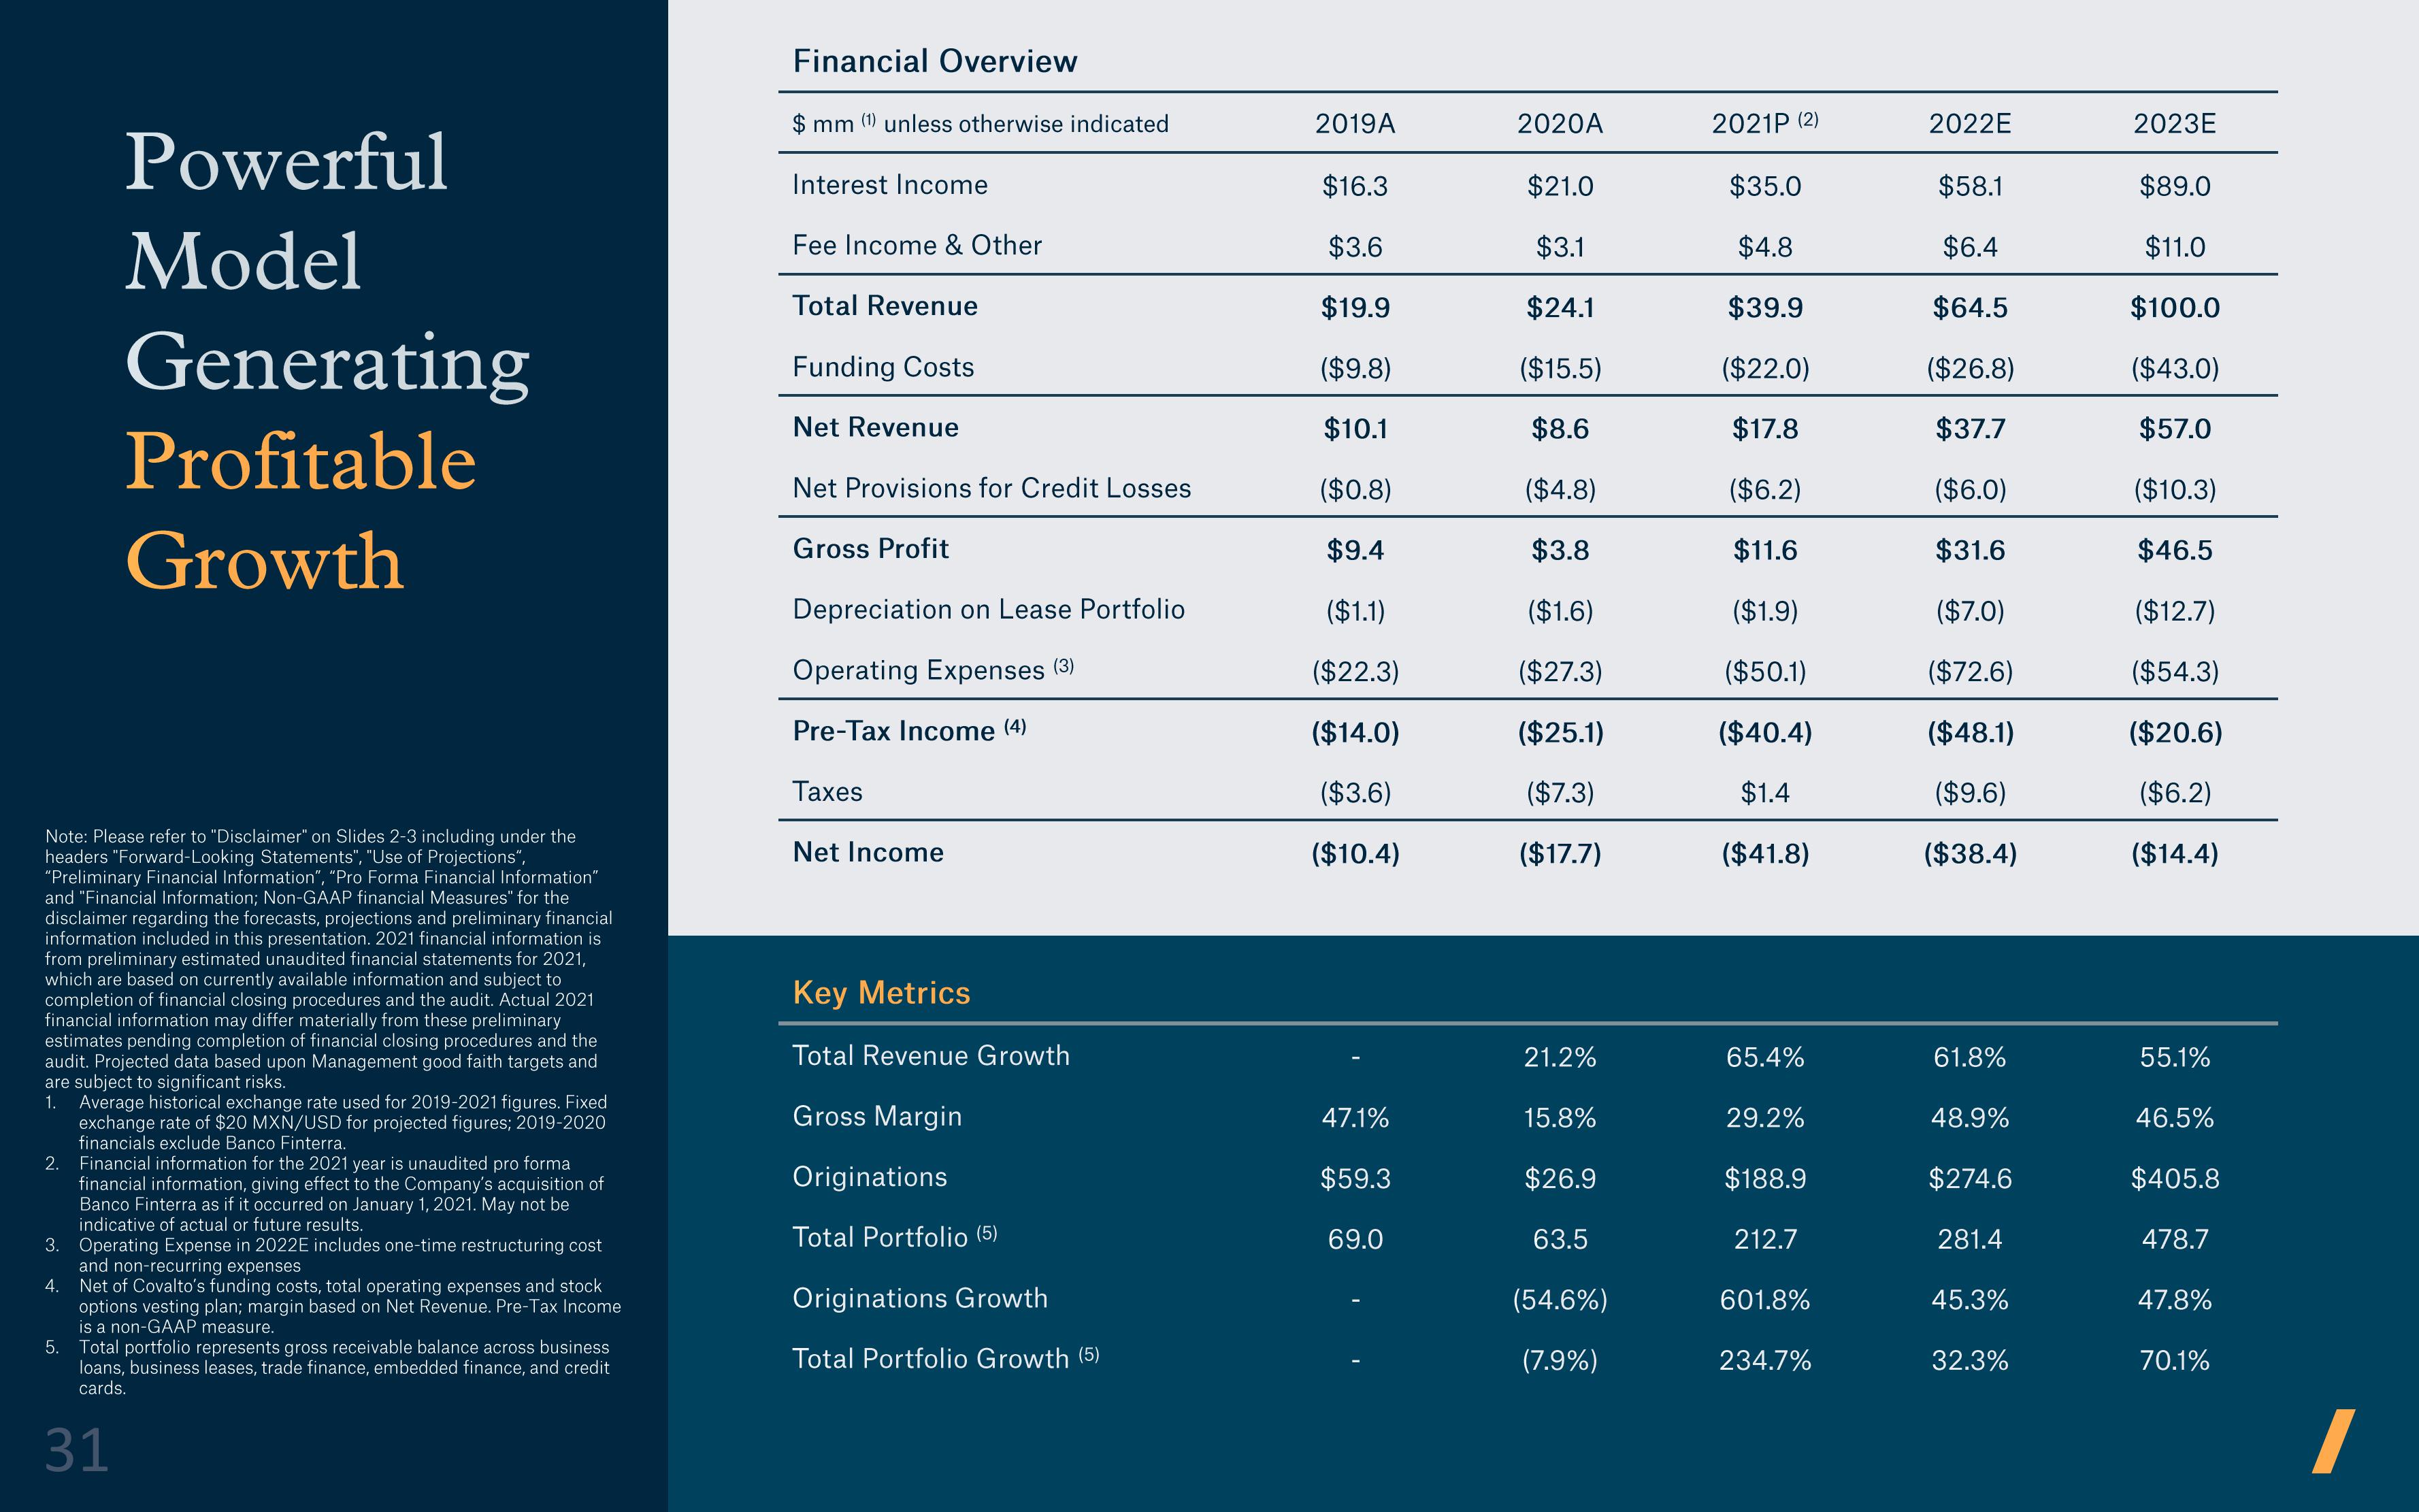
Financial Overview
$ mm (1) unless otherwise indicated
Interest Income
Fee Income & Other
Total Revenue
Funding Costs
Net Revenue
Net Provisions for Credit Losses
Gross Profit
Depreciation on Lease Portfolio
Operating Expenses (3)
Pre-Tax Income (4)
Taxes
Net Income
Key Metrics
Total Revenue Growth
Gross Margin
Originations
Total Portfolio (5)
Originations Growth
Total Portfolio Growth (5)
2019A
$16.3
$3.6
$19.9
($9.8)
$10.1
($0.8)
$9.4
($1.1)
($22.3)
($14.0)
($3.6)
($10.4)
47.1%
$59.3
69.0
2020A
$21.0
$3.1
$24.1
($15.5)
$8.6
($4.8)
$3.8
($1.6)
($27.3)
($25.1)
($7.3)
($17.7)
21.2%
15.8%
$26.9
63.5
(54.6%)
(7.9%)
2021P (2)
$35.0
$4.8
$39.9
($22.0)
$17.8
($6.2)
$11.6
($1.9)
($50.1)
($40.4)
$1.4
($41.8)
65.4%
29.2%
$188.9
212.7
601.8%
234.7%
2022E
$58.1
$6.4
$64.5
($26.8)
$37.7
($6.0)
$31.6
($7.0)
($72.6)
($48.1)
($9.6)
($38.4)
61.8%
48.9%
$274.6
281.4
45.3%
32.3%
2023E
$89.0
$11.0
$100.0
($43.0)
$57.0
($10.3)
$46.5
($12.7)
($54.3)
($20.6)
($6.2)
($14.4)
55.1%
46.5%
$405.8
478.7
47.8%
70.1%View entire presentation