SoftBank Results Presentation Deck
SVF1
PERFORMANCE & IMPACT ON SBG
Contribution to
SBG, Net of 3rd
Party Interests ¹,
Amounts in USD billions
SVF1
Inception to
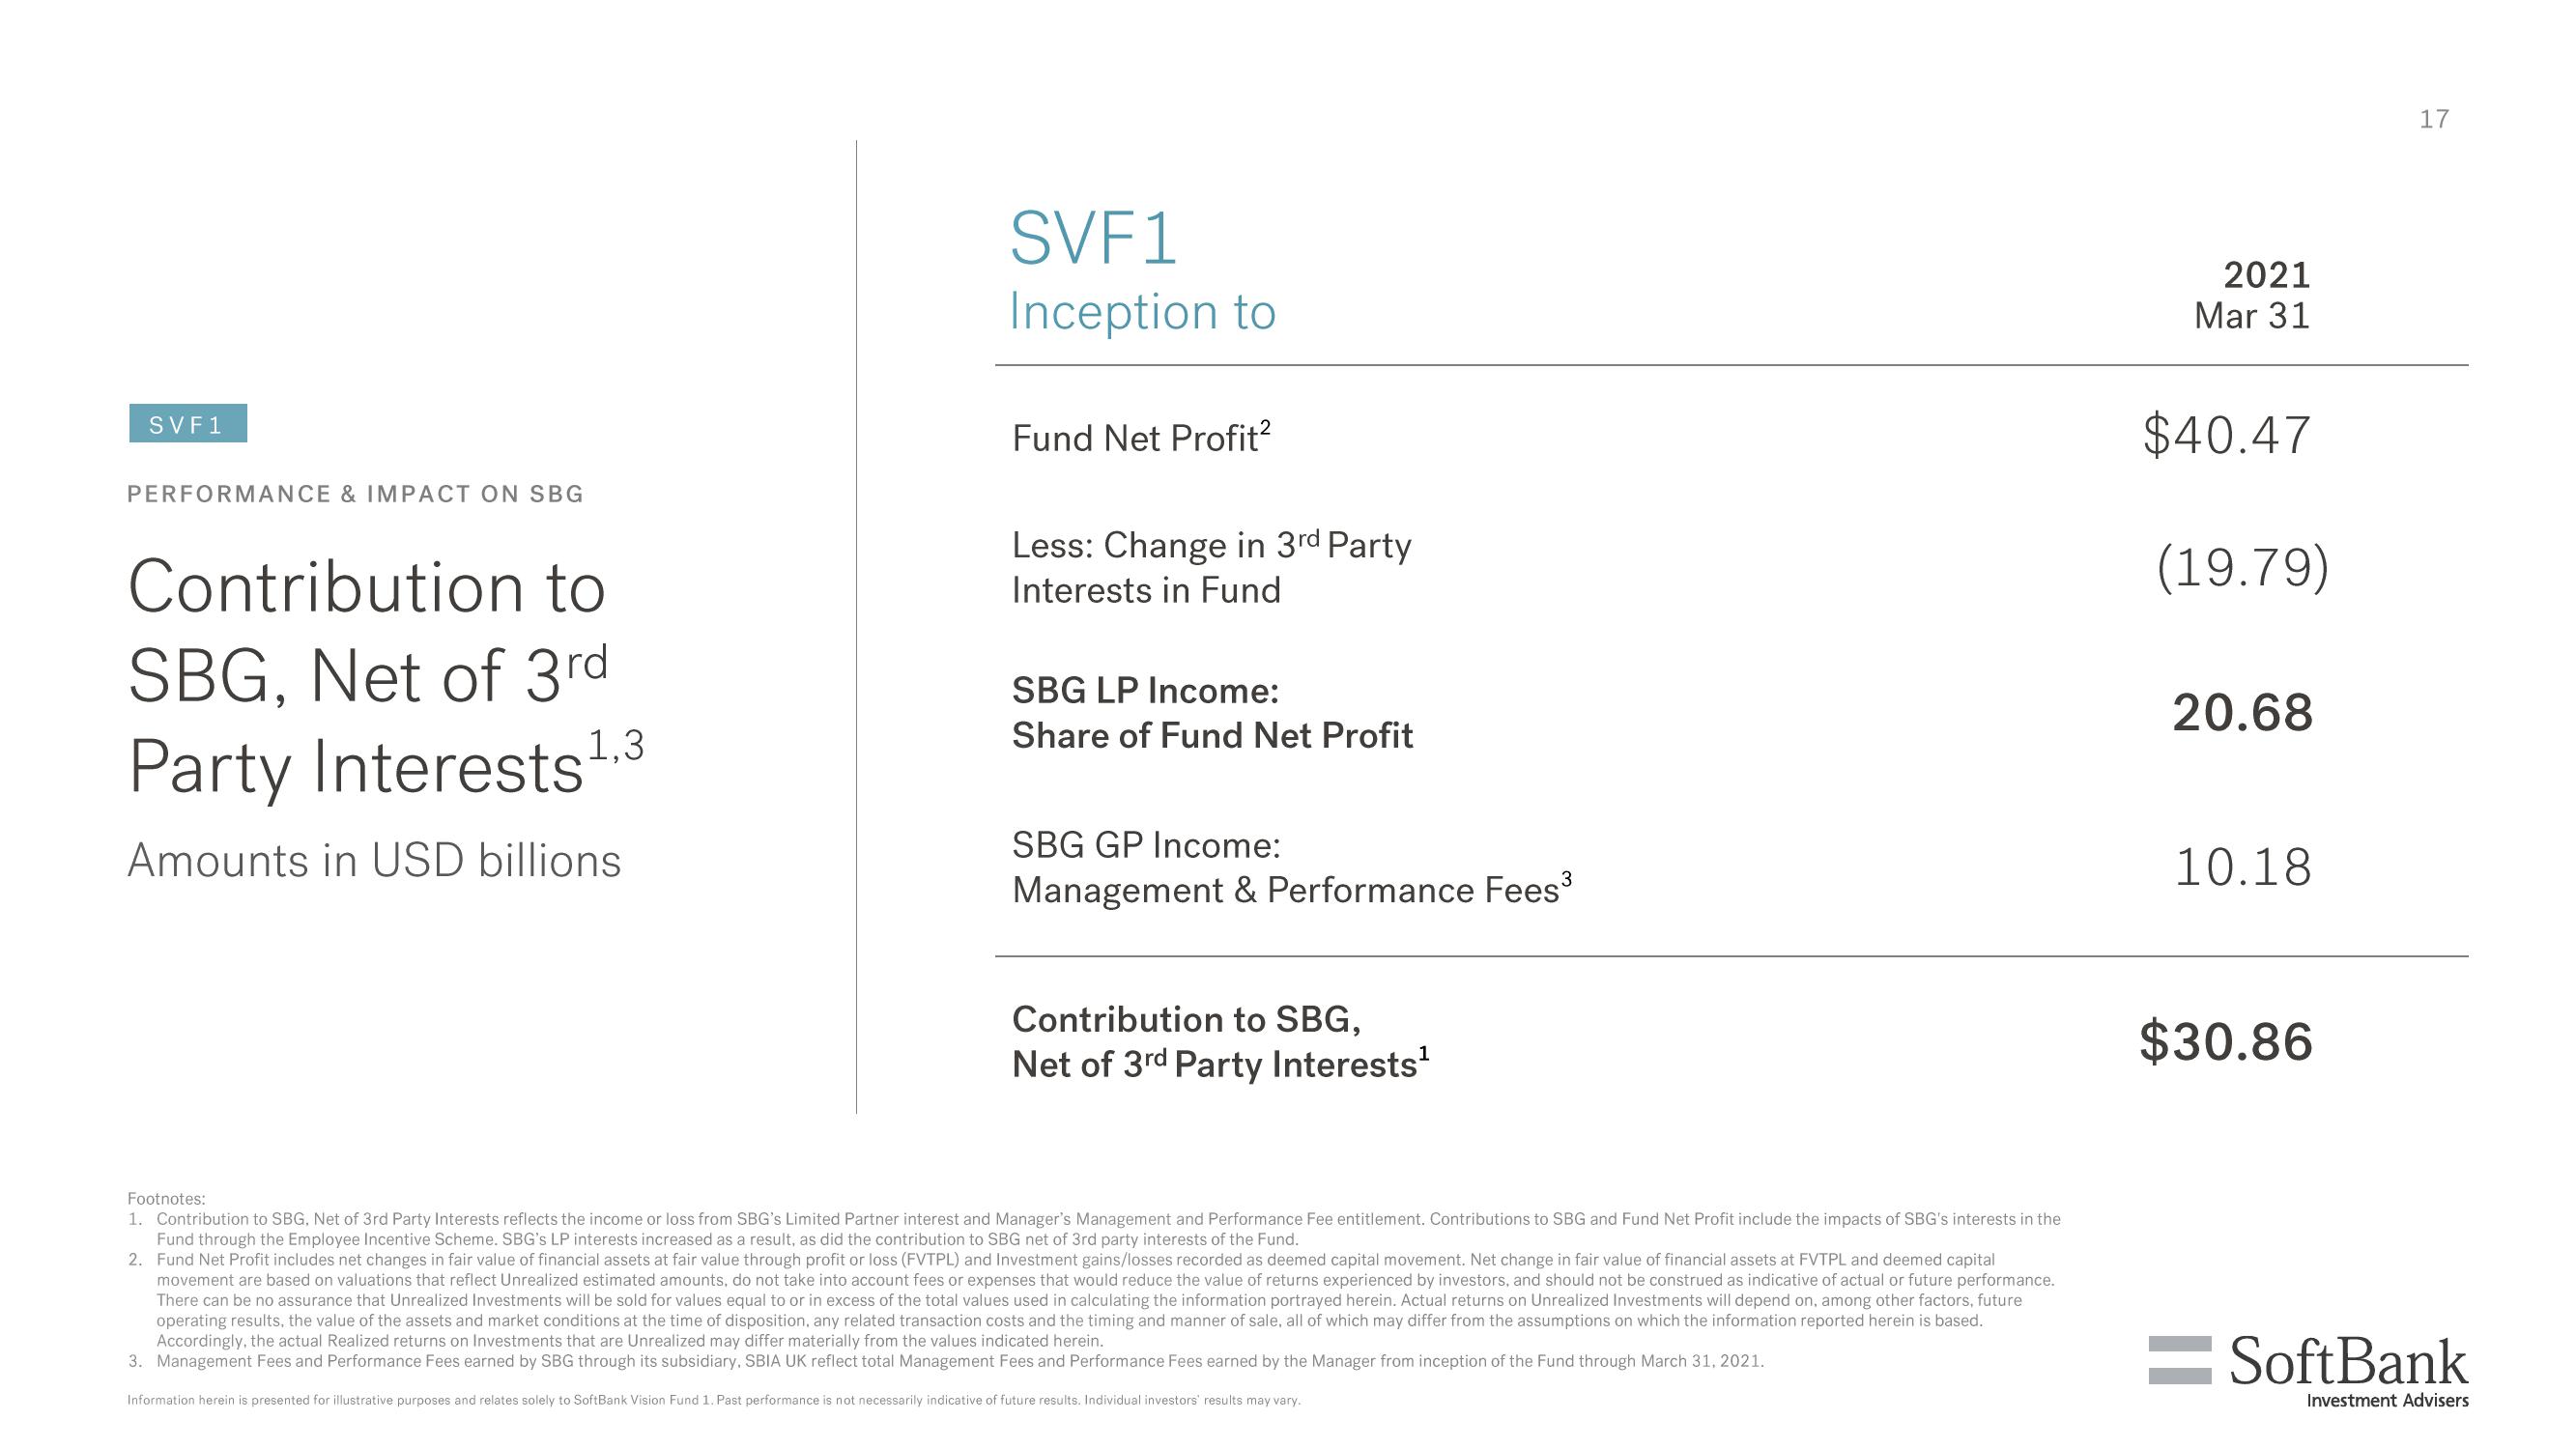
Fund Net Profit²
Less: Change in 3rd Party
Interests in Fund
SBG LP Income:
Share of Fund Net Profit
SBG GP Income:
Management & Performance Fees³
Contribution to SBG,
Net of 3rd Party Interests¹
Footnotes:
1. Contribution to SBG, Net of 3rd Party Interests reflects the income or loss from SBG's Limited Partner interest and Manager's Management and Performance Fee entitlement. Contributions to SBG and Fund Net Profit include the impacts of SBG's interests in the
Fund through the Employee Incentive Scheme. SBG's LP interests increased as a result, as did the contribution to SBG net of 3rd party interests of the Fund.
2. Fund Net Profit includes net changes in fair value of financial assets at fair value through profit or loss (FVTPL) and Investment gains/losses recorded as deemed capital movement. Net change in fair value of financial assets at FVTPL and deemed capital
movement are based on valuations that reflect Unrealized estimated amounts, do not take into account fees or expenses that would reduce the value of returns experienced by investors, and should not be construed as indicative of actual or future performance.
There can be no assurance that Unrealized Investments will be sold for values equal to or in excess of the total values used in calculating the information portrayed herein. Actual returns on Unrealized Investments will depend on, among other factors, future
operating results, the value of the assets and market conditions at the time of disposition, any related transaction costs and the timing and manner of sale, all of which may differ from the assumptions on which the information reported herein is based.
Accordingly, the actual Realized returns on Investments that are Unrealized may differ materially from the values indicated herein.
3. Management Fees and Performance Fees earned by SBG through its subsidiary, SBIA UK reflect total Management Fees and Performance Fees earned by the Manager from inception of the Fund through March 31, 2021.
Information herein is presented for illustrative purposes and relates solely to SoftBank Vision Fund 1. Past performance is not necessarily indicative of future results. Individual investors' results may vary.
2021
Mar 31
$40.47
(19.79)
20.68
10.18
$30.86
17
=SoftBank
Investment AdvisersView entire presentation