TPG Results Presentation Deck
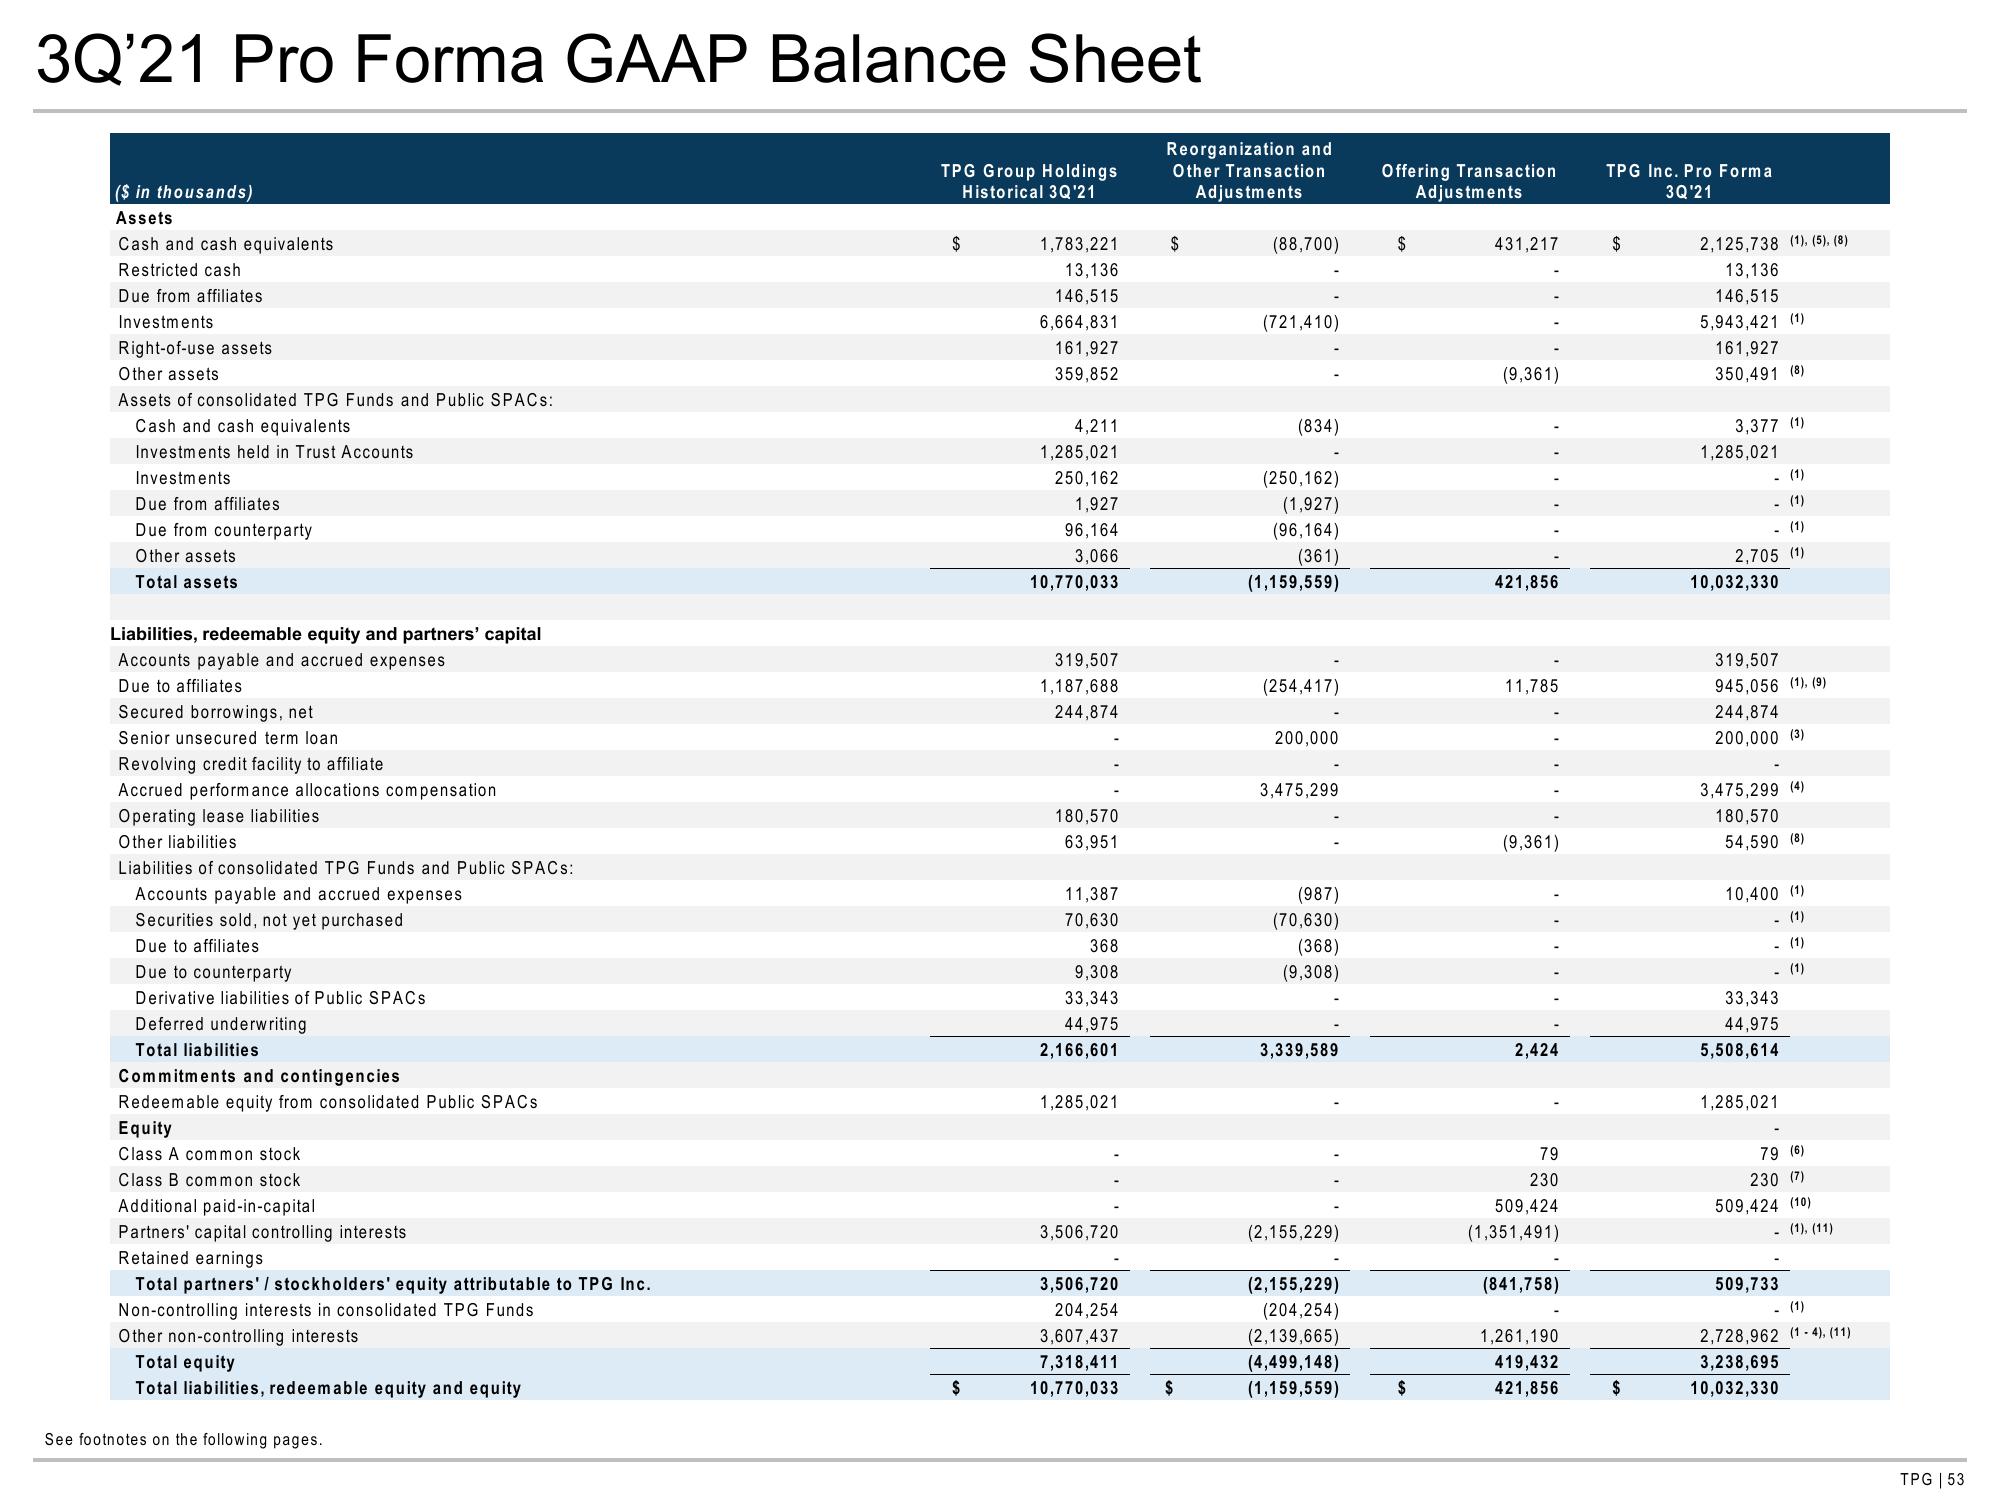
3Q'21 Pro Forma GAAP Balance Sheet
($ in thousands)
Assets
Cash and cash equivalents
Restricted cash
Due from affiliates
Investments
Right-of-use assets
Other assets
Assets of consolidated TPG Funds and Public SPACs:
Cash and cash equivalents
Investments held in Trust Accounts
Investments
Due from affiliates
Due from counterparty
Other assets
Total assets
Liabilities, redeemable equity and partners' capital
Accounts payable and accrued expenses
Due to affiliates
Secured borrowings, net
Senior unsecured term loan
Revolving credit facility to affiliate
Accrued performance allocations compensation
Operating lease liabilities.
Other liabilities
Liabilities of consolidated TPG Funds and Public SPACs:
Accounts payable and accrued expenses
Securities sold, not yet purchased
Due to affiliates
Due to counterparty
Derivative liabilities of Public SPACs
Deferred underwriting
Total liabilities
Commitments and contingencies
Redeemable equity from consolidated Public SPACS
Equity
Class A common stock
Class B common stock
Additional paid-in-capital
Partners' capital controlling interests
Retained earnings
Total partners' / stockholders' equity attributable to TPG Inc.
Non-controlling interests in consolidated TPG Funds
Other non-controlling interests
Total equity
Total liabilities, redeemable equity and equity
See footnotes on the following pages.
TPG Group Holdings
Historical 3Q'21
$
$
1,783,221
13,136
146,515
6,664,831
161,927
359,852
4,211
1,285,021
250,162
1,927
96,164
3,066
10,770,033
319,507
1,187,688
244,874
180,570
63,951
11,387
70,630
368
9,308
33,343
44,975
2,166,601
1,285,021
3,506,720
3,506,720
204,254
3,607,437
7,318,411
10,770,033
Reorganization and
Other Transaction
Adjustments
$
$
(88,700)
(721,410)
(834)
(250,162)
(1,927)
(96,164)
(361)
(1,159,559)
(254,417)
200,000
3,475,299
(987)
(70,630)
(368)
(9,308)
3,339,589
(2,155,229)
(2,155,229)
(204,254)
(2,139,665)
(4,499,148)
(1,159,559)
Offering Transaction
Adjustments
$
$
431,217
(9,361)
421,856
11,785
(9,361)
2,424
79
230
509,424
(1,351,491)
(841,758)
1,261,190
419,432
421,856
TPG Inc. Pro Forma
3Q'21
$
$
2,125,738 (1), (5), (8)
13,136
146,515
5,943,421 (1)
161,927
350,491 (8)
3,377 (1)
1,285,021
- (1)
- (1)
- (1)
2,705 (1)
10,032,330
319,507
945,056 (1), (9)
244,874
200,000 (3)
3,475,299 (4)
180,570
54,590 (8)
10,400 (1)
(1)
(1)
- (1)
33,343
44,975
5,508,614
1,285,021
79 (6)
230 (7)
509,424 (10)
509,733
(1), (11)
- (1)
2,728,962 (1-4), (11)
3,238,695
10,032,330
TPG | 53View entire presentation