DigitalOcean Results Presentation Deck
→ Financial
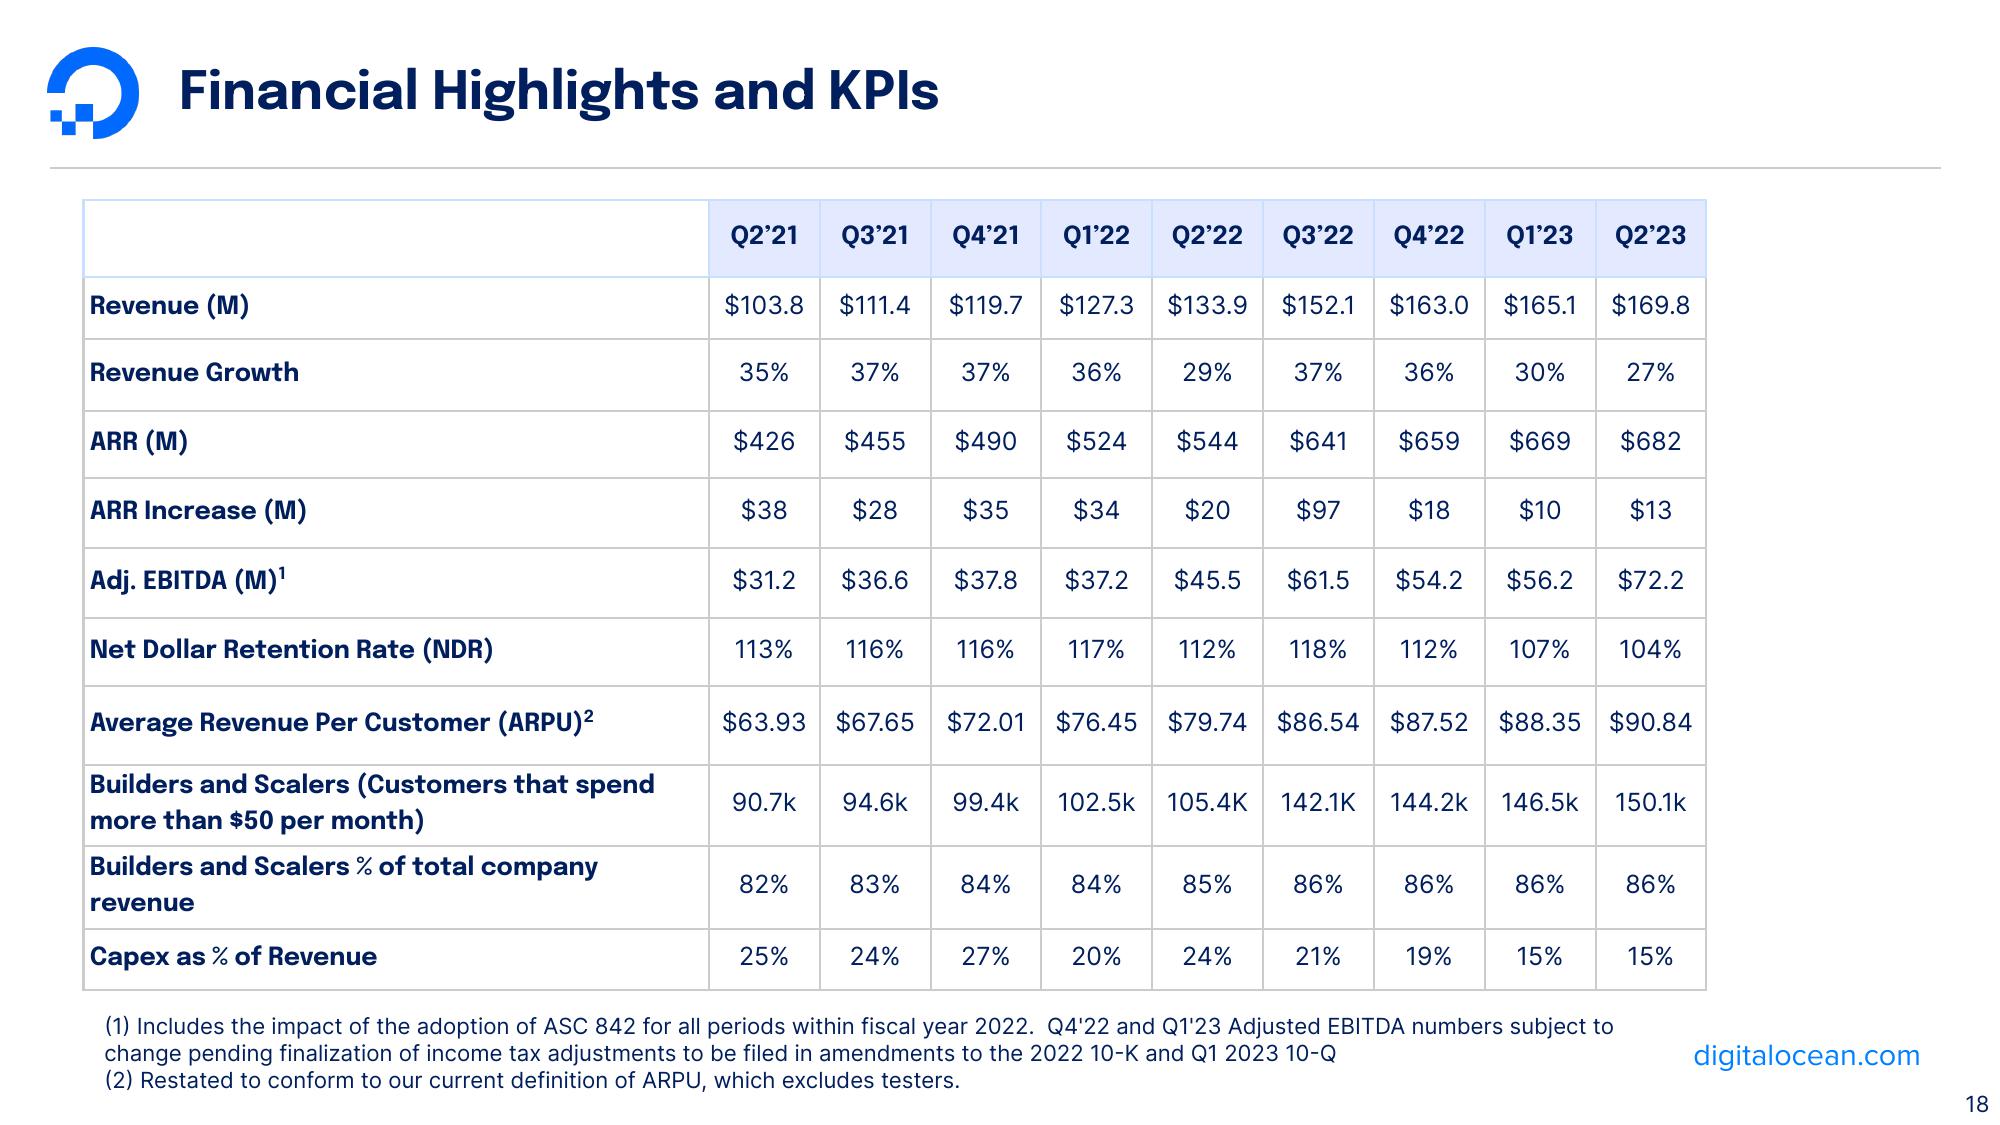
Financial Highlights and KPIs
Revenue (M)
Revenue Growth
ARR (M)
ARR Increase (M)
Adj. EBITDA (M)¹
Net Dollar Retention Rate (NDR)
Average Revenue Per Customer (ARPU)²
Builders and Scalers (Customers that spend
more than $50 per month)
Builders and Scalers % of total company
revenue
Capex as % of Revenue
Q2'21 Q3'21 Q4'21
$103.8 $111.4 $119.7
35%
$426
$38
$31.2
37%
$455
82%
25%
$36.6
$28 $35
37%
113% 116% 116%
$490
$63.93 $67.65 $72.01
90.7k 94.6k 99.4k
83%
$37.8
24%
84%
27%
Q1'22 Q2'22 Q3'22 Q4'22 Q1'23 Q2'23
$127.3 $133.9 $152.1
36%
$524
$34
$37.2
117%
102.5k
84%
29%
20%
$544
$20
$76.45 $79.74
$45.5
112%
85%
37%
24%
$641
$97
$61.5
$163.0 $165.1 $169.8
36%
86%
$659
21%
30%
$18 $10
118% 112% 107%
105.4K 142.1K 144.2k 146.5k
$669
$54.2 $56.2
86%
19%
$86.54 $87.52 $88.35 $90.84
86%
15%
27%
$682
(1) Includes the impact of the adoption of ASC 842 for all periods within fiscal year 2022. Q4'22 and Q1'23 Adjusted EBITDA numbers subject to
change pending finalization of income tax adjustments to be filed in amendments to the 2022 10-K and Q1 2023 10-Q
(2) Restated to conform to our current definition of ARPU, which excludes testers.
$13
$72.2
104%
150.1K
86%
15%
digitalocean.com
18View entire presentation