J.P.Morgan Investment Banking Pitch Book
APPENDIX
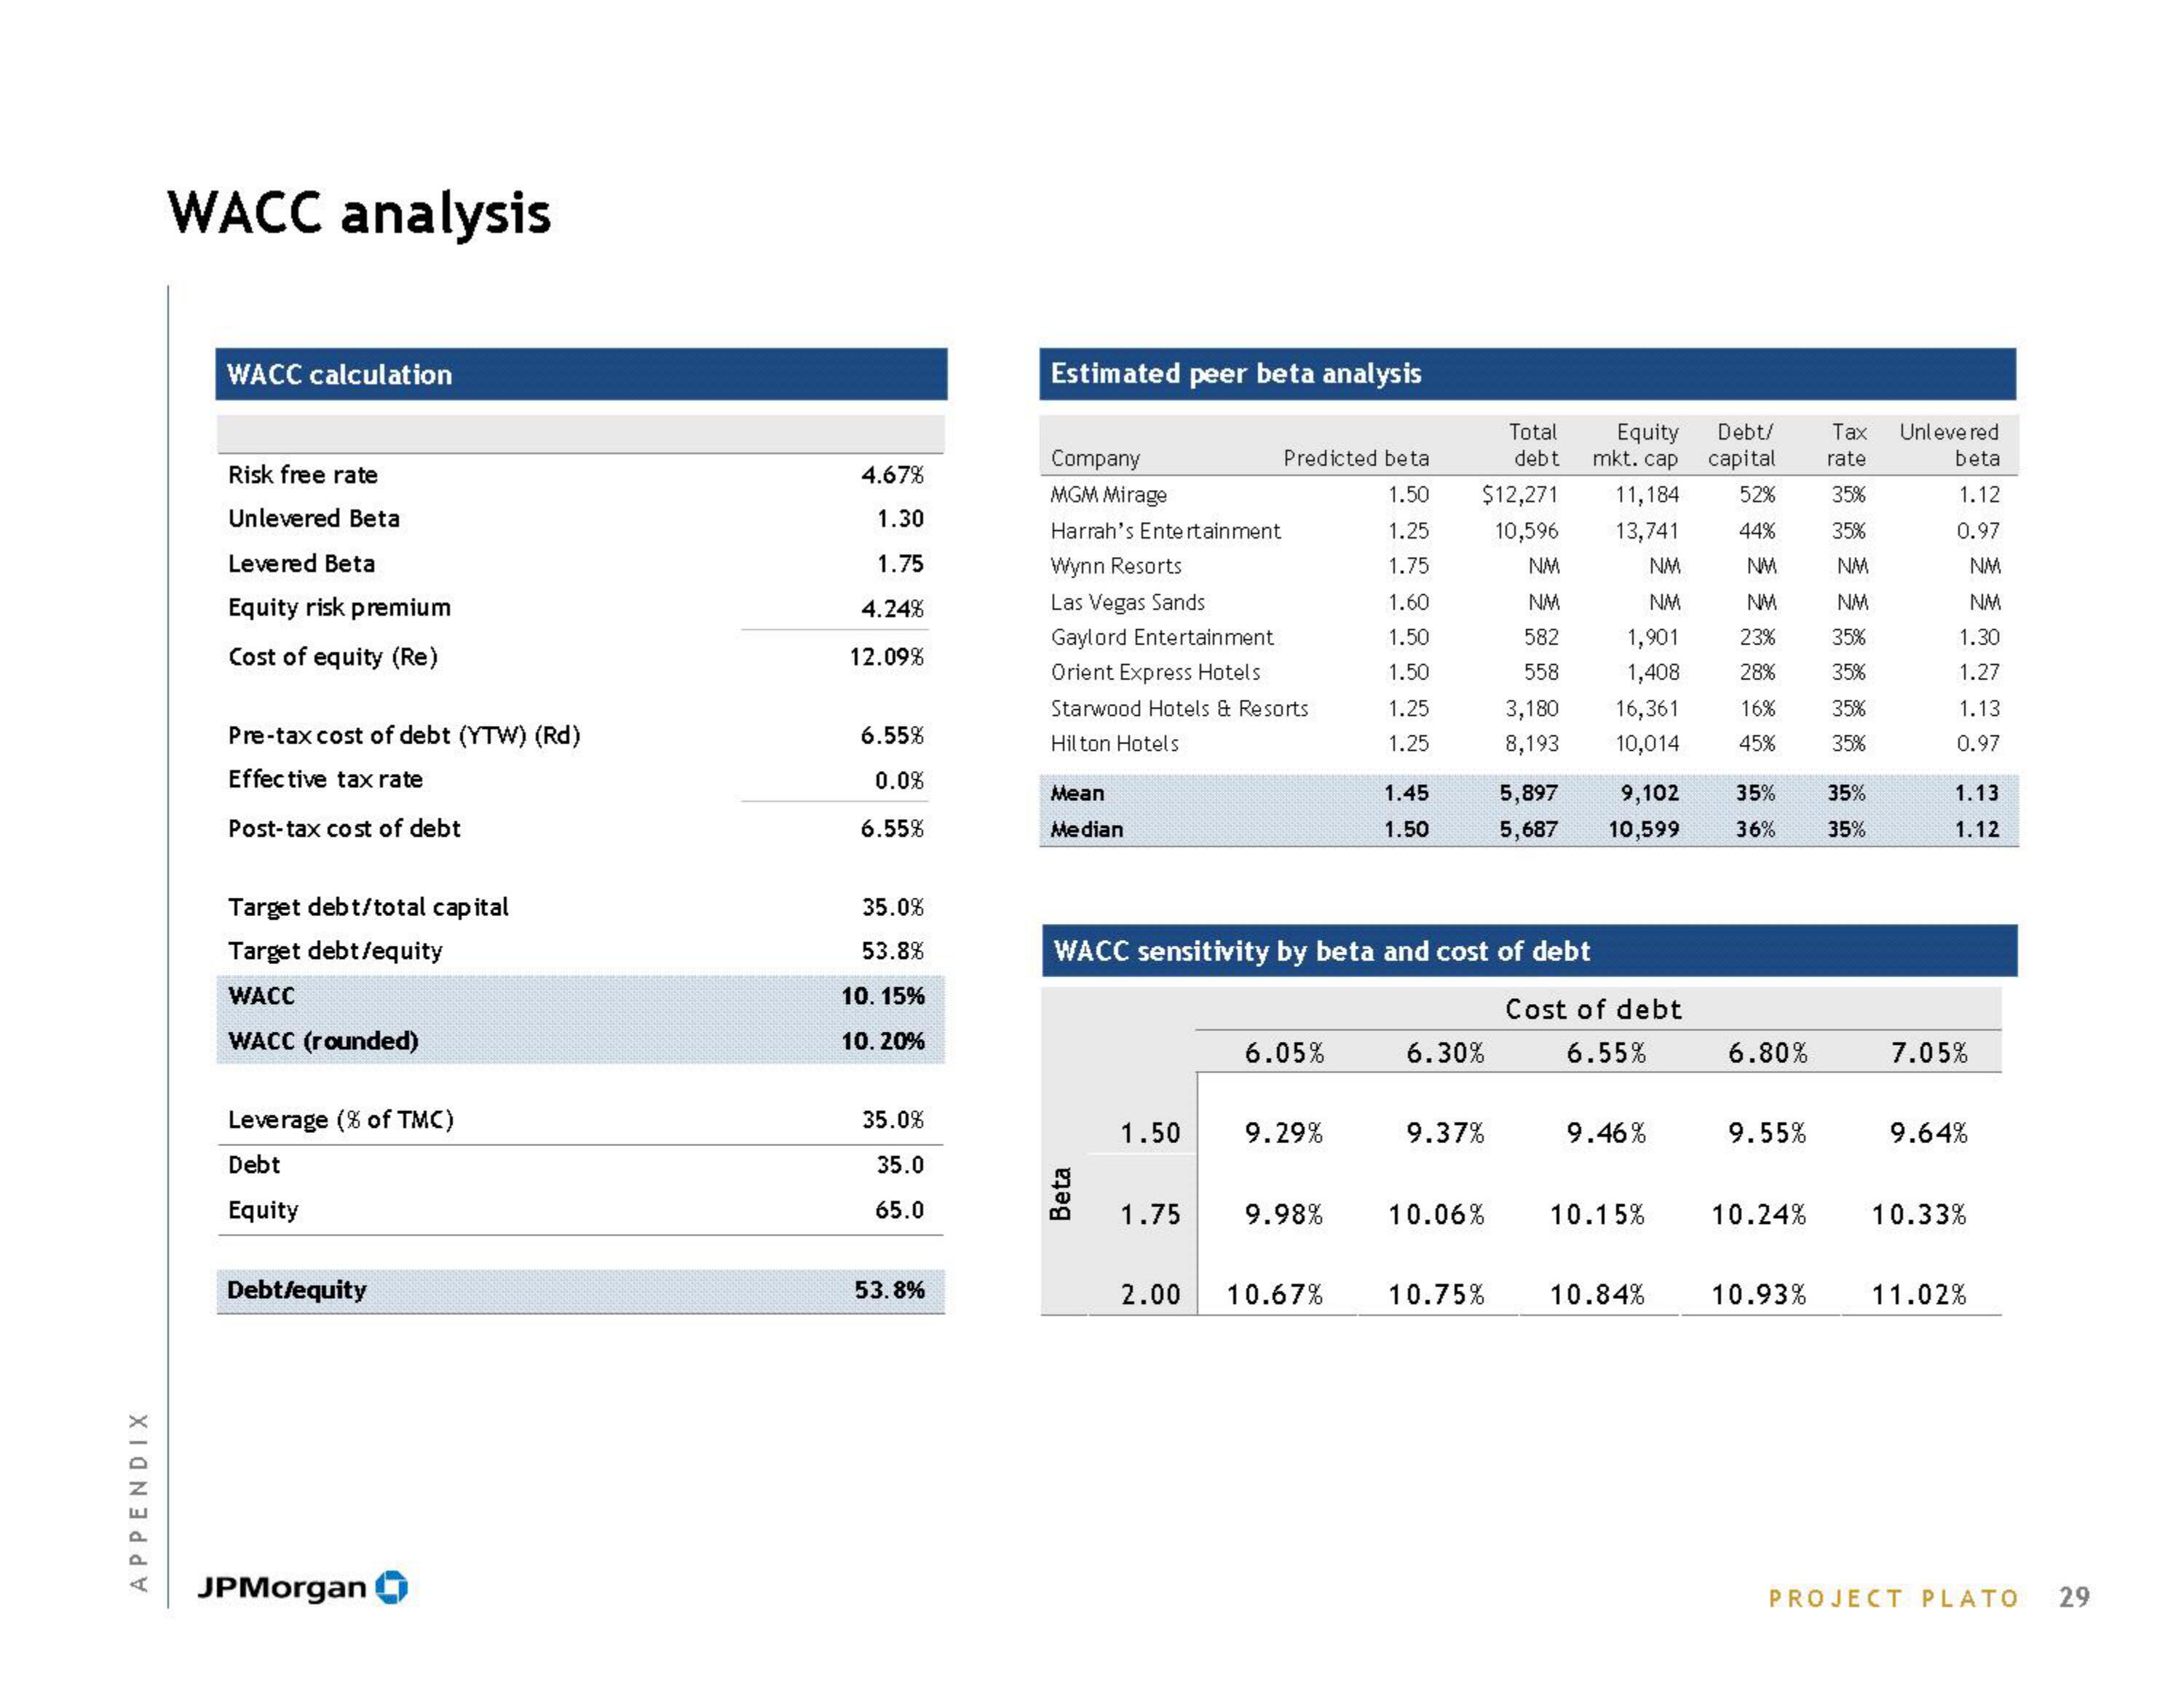
WACC analysis
WACC calculation
Risk free rate
Unlevered Beta
Levered Beta
Equity risk premium
Cost of equity (Re)
Pre-tax cost of debt (YTW) (Rd)
Effective tax rate
Post-tax cost of debt
Target debt/total capital
Target debt/equity
WACC
WACC (rounded)
Leverage (% of TMC)
Debt
Equity
Debt/equity
JPMorgan
4.67%
1.30
1.75
4.24%
12.09%
6.55%
0.0%
6.55%
35.0%
53.8%
10. 15%
10.20%
35.0%
35.0
65.0
53.8%
Estimated peer beta analysis
Company
MGM Mirage
Harrah's Entertainment
Wynn Resorts
Las Vegas Sands
Gaylord Entertainment
Orient Express Hotels
Starwood Hotels & Resorts
Hilton Hotels
Mean
Median
Beta
1.50
Predicted beta
1.50
1.25
1.75
1.60
1.50
1.50
1.25
1.25
1.75
WACC sensitivity by beta and cost of debt
2.00
6.05%
9.29%
9.98%
1.45
1.50
10.67%
Total Equity
debt
mkt. cap
$12,271 11,184
10,596 13,741
NM
NM
NM
NM
582
1,901
558
3,180
1,408
16,361
10,014
8,193
6.30%
9.37%
10.06%
5,897
5,687
10.75%
Cost of debt
6.55%
9,102 35%
10,599
36%
9.46%
10.15%
Debt/
capital
52%
44%
NM
10.84%
NM
23%
28%
16%
45%
6.80%
9.55%
10.24%
10.93%
Tax
rate
35%
35%
NM
NM
35%
35%
35%
35%
35%
35%
Unlevered
beta
1.12
0.97
NM
NM
1.30
1.27
1.13
0.97
1.13
1.12
7.05%
9.64%
10.33%
11.02%
PROJECT PLATO 29View entire presentation