Carlyle Investor Conference Presentation Deck
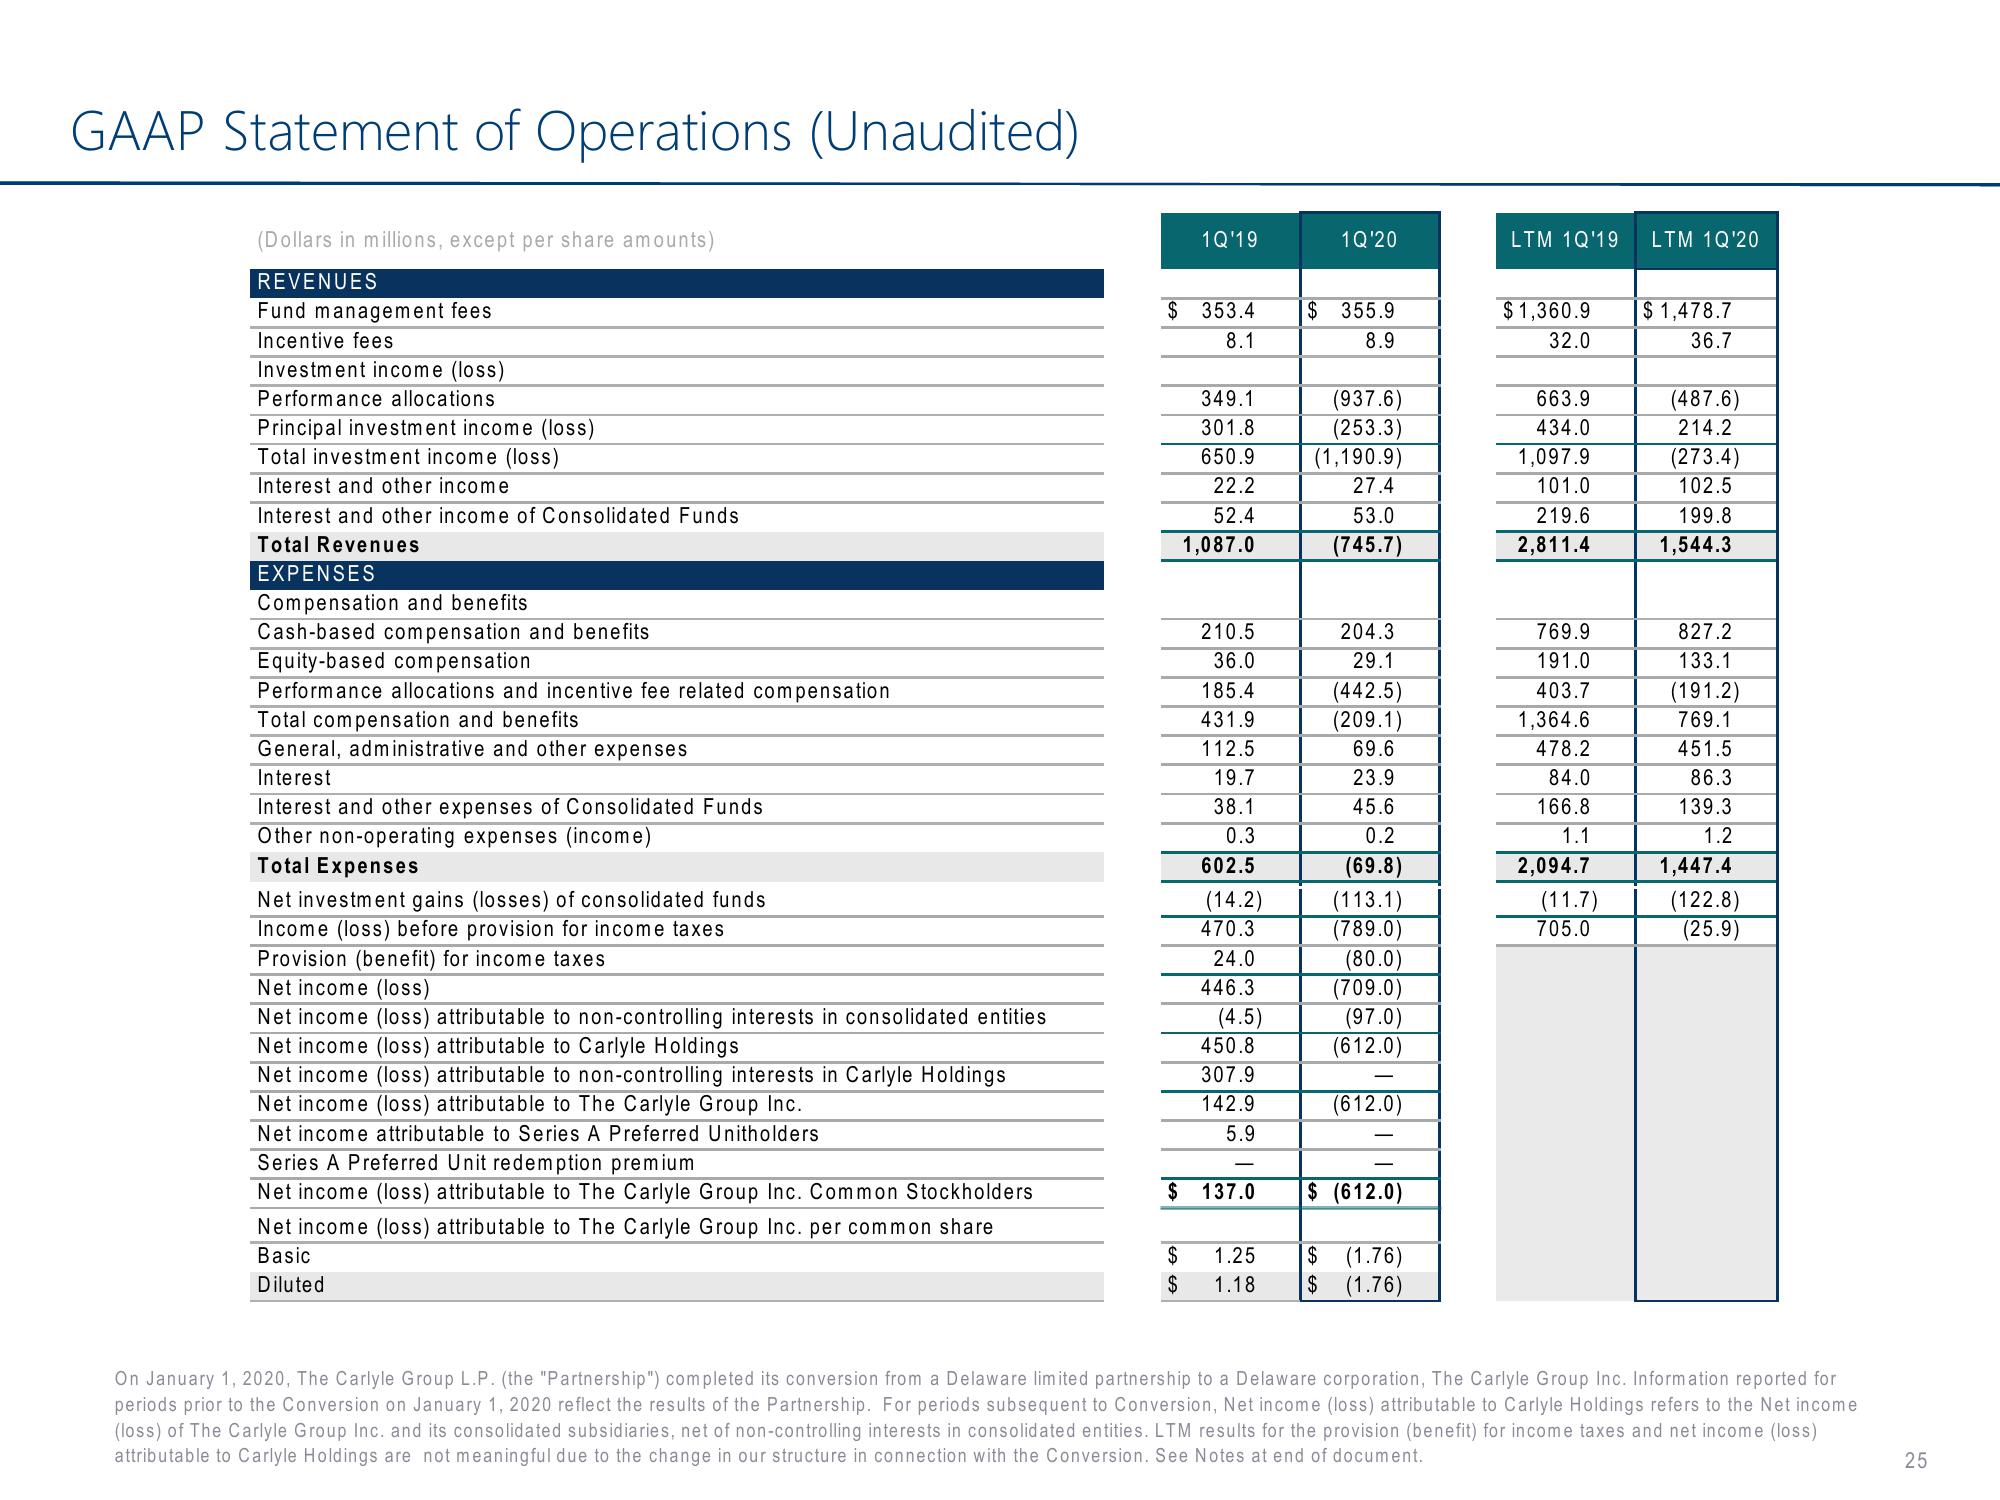
GAAP Statement of Operations (Unaudited)
(Dollars in millions, except per share amounts)
REVENUES
Fund management fees
Incentive fees
Investment income (loss)
Performance allocations.
Principal investment income (loss)
Total investment income (loss)
Interest and other income
Interest and other income of Consolidated Funds
Total Revenues
EXPENSES
Compensation and benefits
Cash-based compensation and benefits
Equity-based compensation
Performance allocations and incentive fee related compensation
Total compensation and benefits
General, administrative and other expenses
Interest
Interest and other expenses of Consolidated Funds
Other non-operating expenses (income)
Total Expenses
Net investment gains (losses) of consolidated funds
Income (loss) before provision for income taxes
Provision (benefit) for income taxes
Net income (loss)
Net income (loss) attributable to non-controlling interests in consolidated entities
Net income (loss) attributable to Carlyle Holdings
Net income (loss) attributable to non-controlling interests in Carlyle Holdings
Net income (loss) attributable to The Carlyle Group Inc.
Net income attributable to Series A Preferred Unitholders
Series A Preferred Unit redemption premium
Net income (loss) attributable to The Carlyle Group Inc. Common Stockholders
Net income (loss) attributable to The Carlyle Group Inc. per common share
Basic
Diluted
1Q'19
$ 353.4
8.1
349.1
301.8
650.9
22.2
52.4
1,087.0
GA GA
210.5
36.0
185.4
431.9
112.5
19.7
38.1
0.3
602.5
(14.2)
470.3
24.0
446.3
(4.5)
450.8
307.9
142.9
5.9
$ 137.0
$ 1.25
$ 1.18
1Q'20
$ 355.9
8.9
(937.6)
(253.3)
(1,190.9)
27.4
53.0
(745.7)
204.3
29.1
(442.5)
(209.1)
69.6
23.9
45.6
0.2
(69.8)
(113.1)
(789.0)
(80.0)
(709.0)
(97.0)
(612.0)
(612.0)
$ (612.0)
$ (1.76)
$ (1.76)
LTM 1Q'19 LTM 1Q'20
$1,360.9
32.0
663.9
434.0
1,097.9
101.0
219.6
2,811.4
769.9
191.0
403.7
1,364.6
478.2
84.0
166.8
1.1
2,094.7
(11.7)
705.0
$1,478.7
36.7
(487.6)
214.2
(273.4)
102.5
199.8
1,544.3
827.2
133.1
(191.2)
769.1
451.5
86.3
139.3
1.2
1,447.4
(122.8)
(25.9)
On January 1, 2020, The Carlyle Group L.P. (the "Partnership") completed its conversion from a Delaware limited partnership to a Delaware corporation, The Carlyle Group Inc. Information reported for
periods prior to the Conversion on January 1, 2020 reflect the results of the Partnership. For periods subsequent to Conversion, Net income (loss) attributable to Carlyle Holdings refers to the Net income
(loss) of The Carlyle Group Inc. and its consolidated subsidiaries, net of non-controlling interests in consolidated entities. LTM results for the provision (benefit) for income taxes and net income (loss)
attributable to Carlyle Holdings are not meaningful due to the change in our structure in connection with the Conversion. See Notes at end of document.
25View entire presentation