Adtheorent SPAC Presentation Deck
Financial Highlights
1
2
3
4
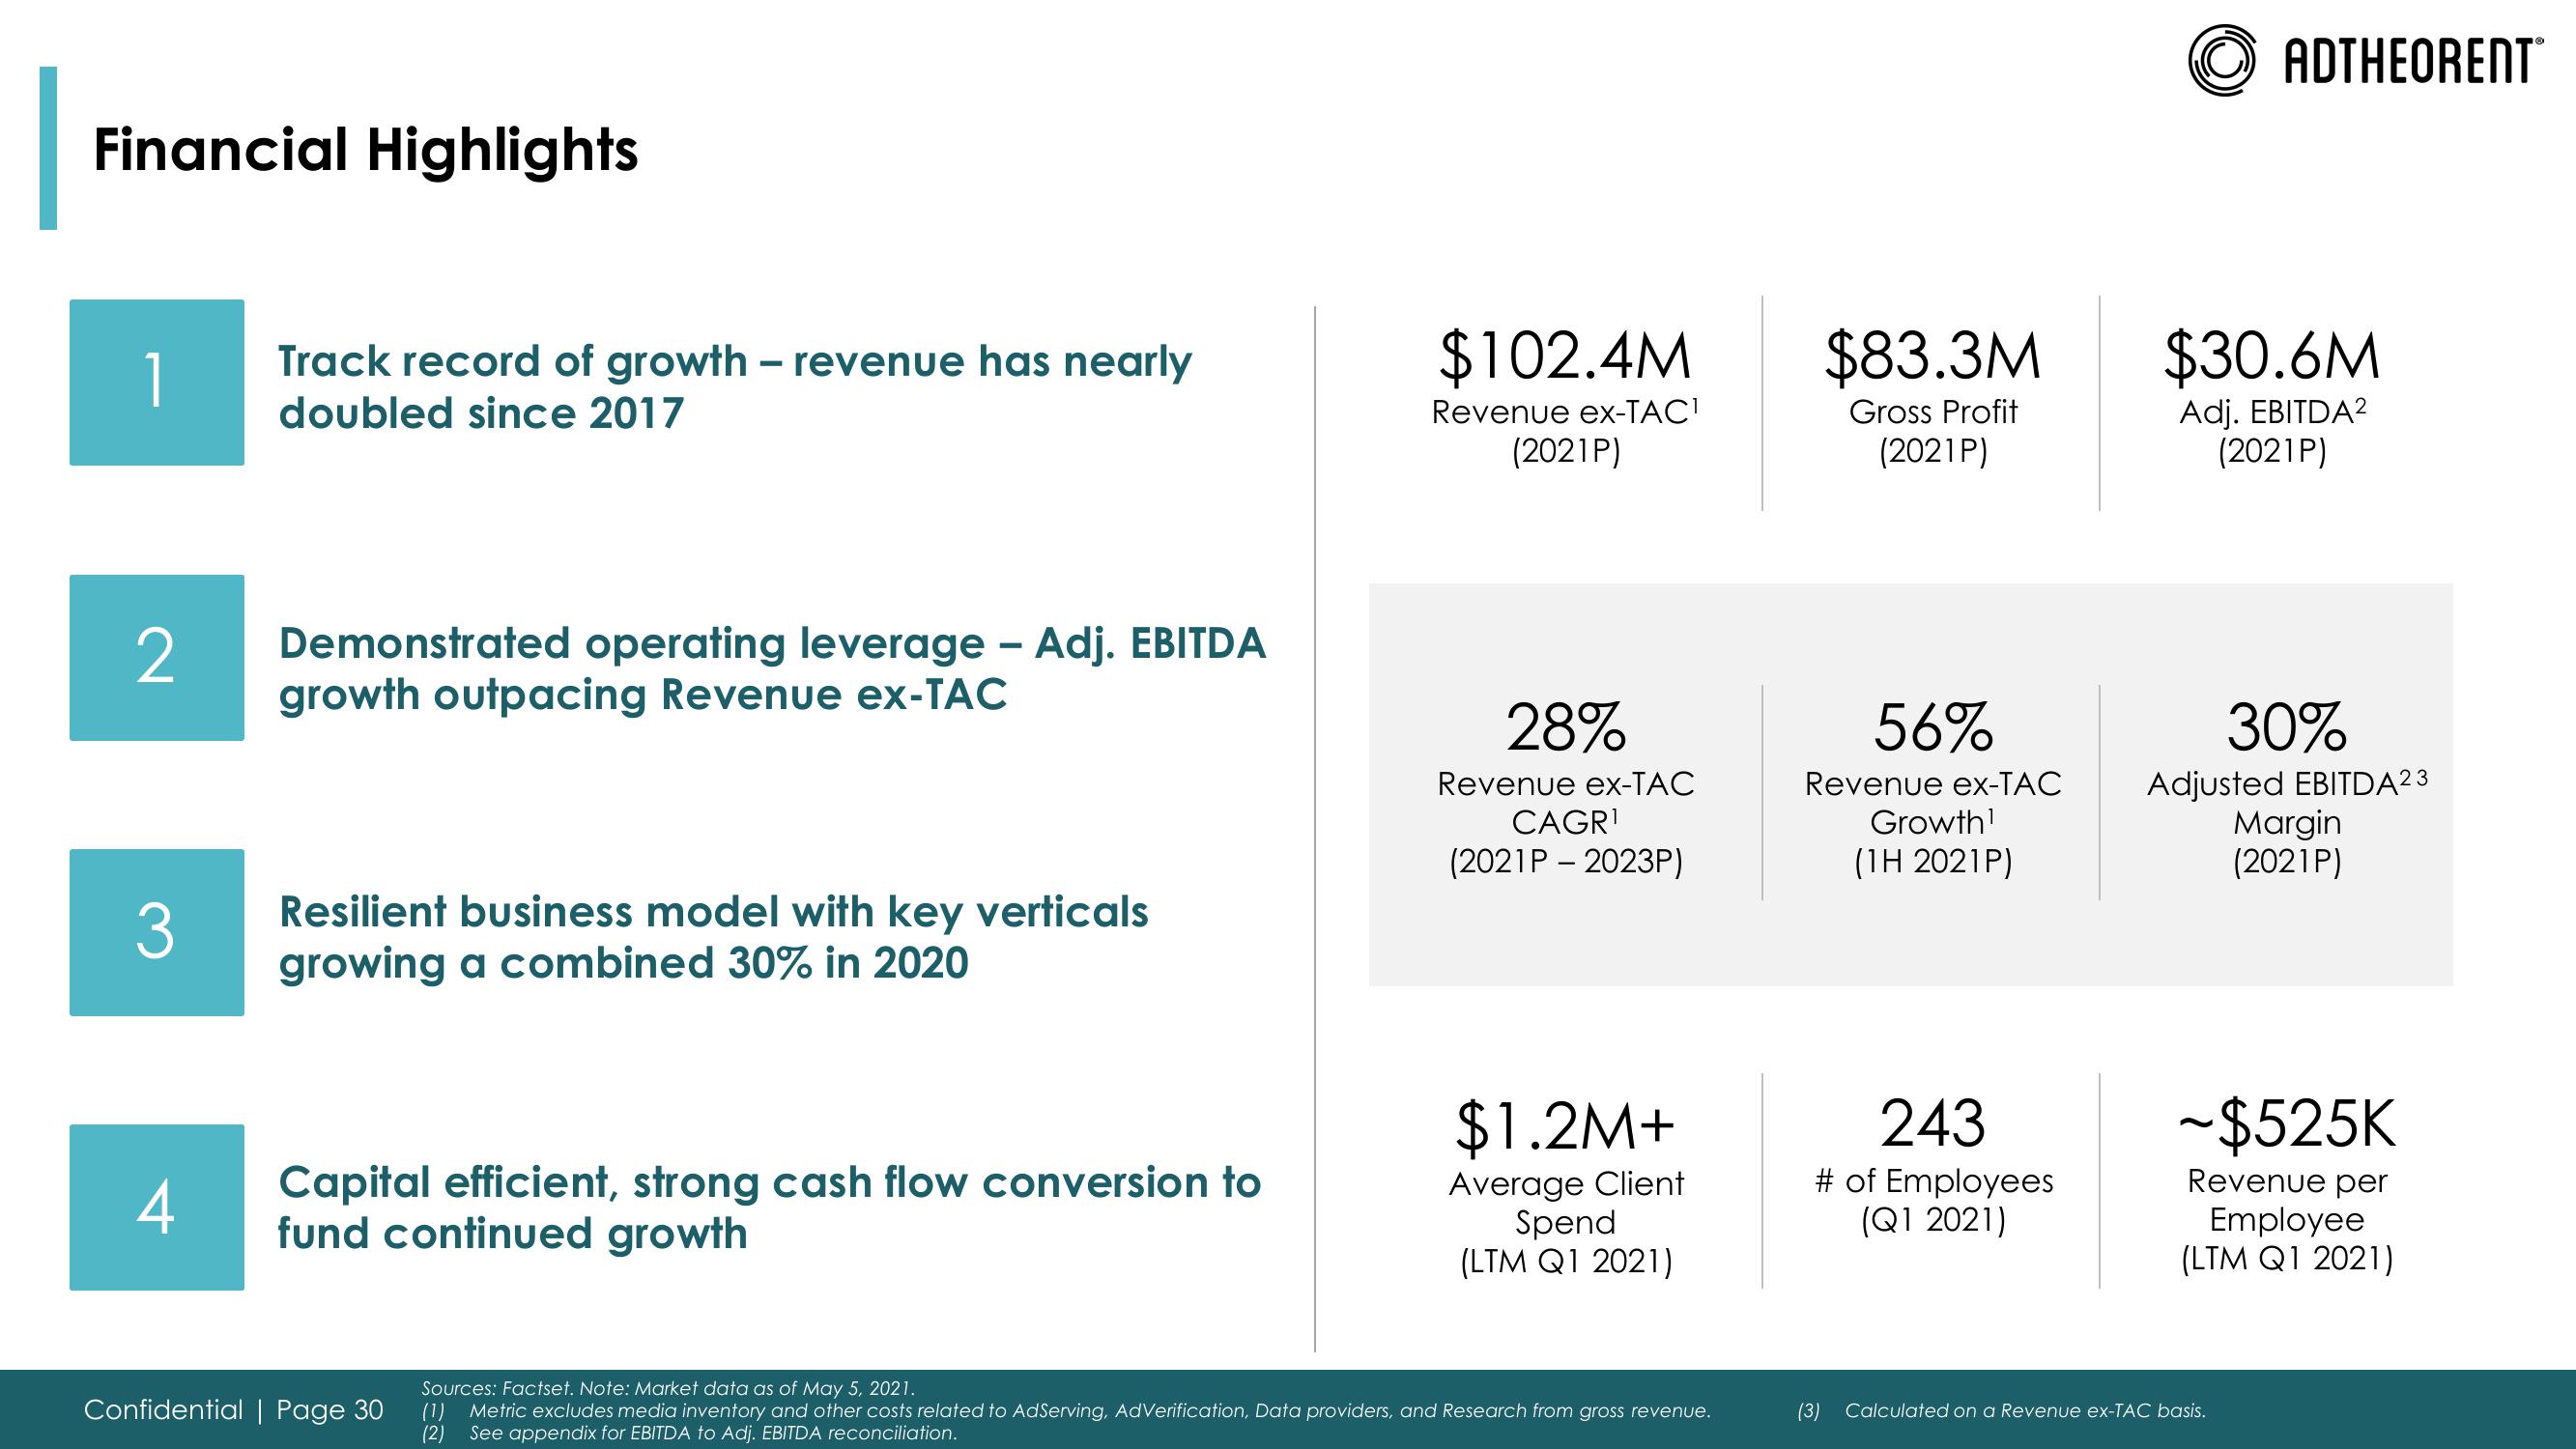
Track record of growth - revenue has nearly
doubled since 2017
Demonstrated operating leverage - Adj. EBITDA
growth outpacing Revenue ex-TAC
Resilient business model with key verticals
growing a combined 30% in 2020
Capital efficient, strong cash flow conversion to
fund continued growth
Confidential | Page 30
$102.4M
Revenue ex-TAC¹
(2021P)
28%
Revenue ex-TAC
CAGR¹
(2021P - 2023P)
$1.2M+
Average Client
Spend
(LTM Q1 2021)
Sources: Factset. Note: Market data as of May 5, 2021.
(1) Metric excludes media inventory and other costs related to AdServing, AdVerification, Data providers, and Research from gross revenue.
(2) See appendix for EBITDA to Adj. EBITDA reconciliation.
$83.3M
Gross Profit
(2021P)
56%
Revenue ex-TAC
Growth¹
(1H 2021P)
243
# of Employees
(Q1 2021)
(3)
ADTHEORENT
$30.6M
Adj. EBITDA²
(2021P)
30%
Adjusted EBITDA23
Margin
(2021P)
~$525K
Revenue per
Employee
(LTM Q1 2021)
Calculated on a Revenue ex-TAC basis.View entire presentation