Summit Hotel Properties Investor Presentation Deck
19
Targeted Capital Allocation Strategy with Proven Track Record of
Transaction Driven Value Creation
$1,200
$900
$600
$300
48%
36%
(1)
(2)
24%
12%
0%
$0
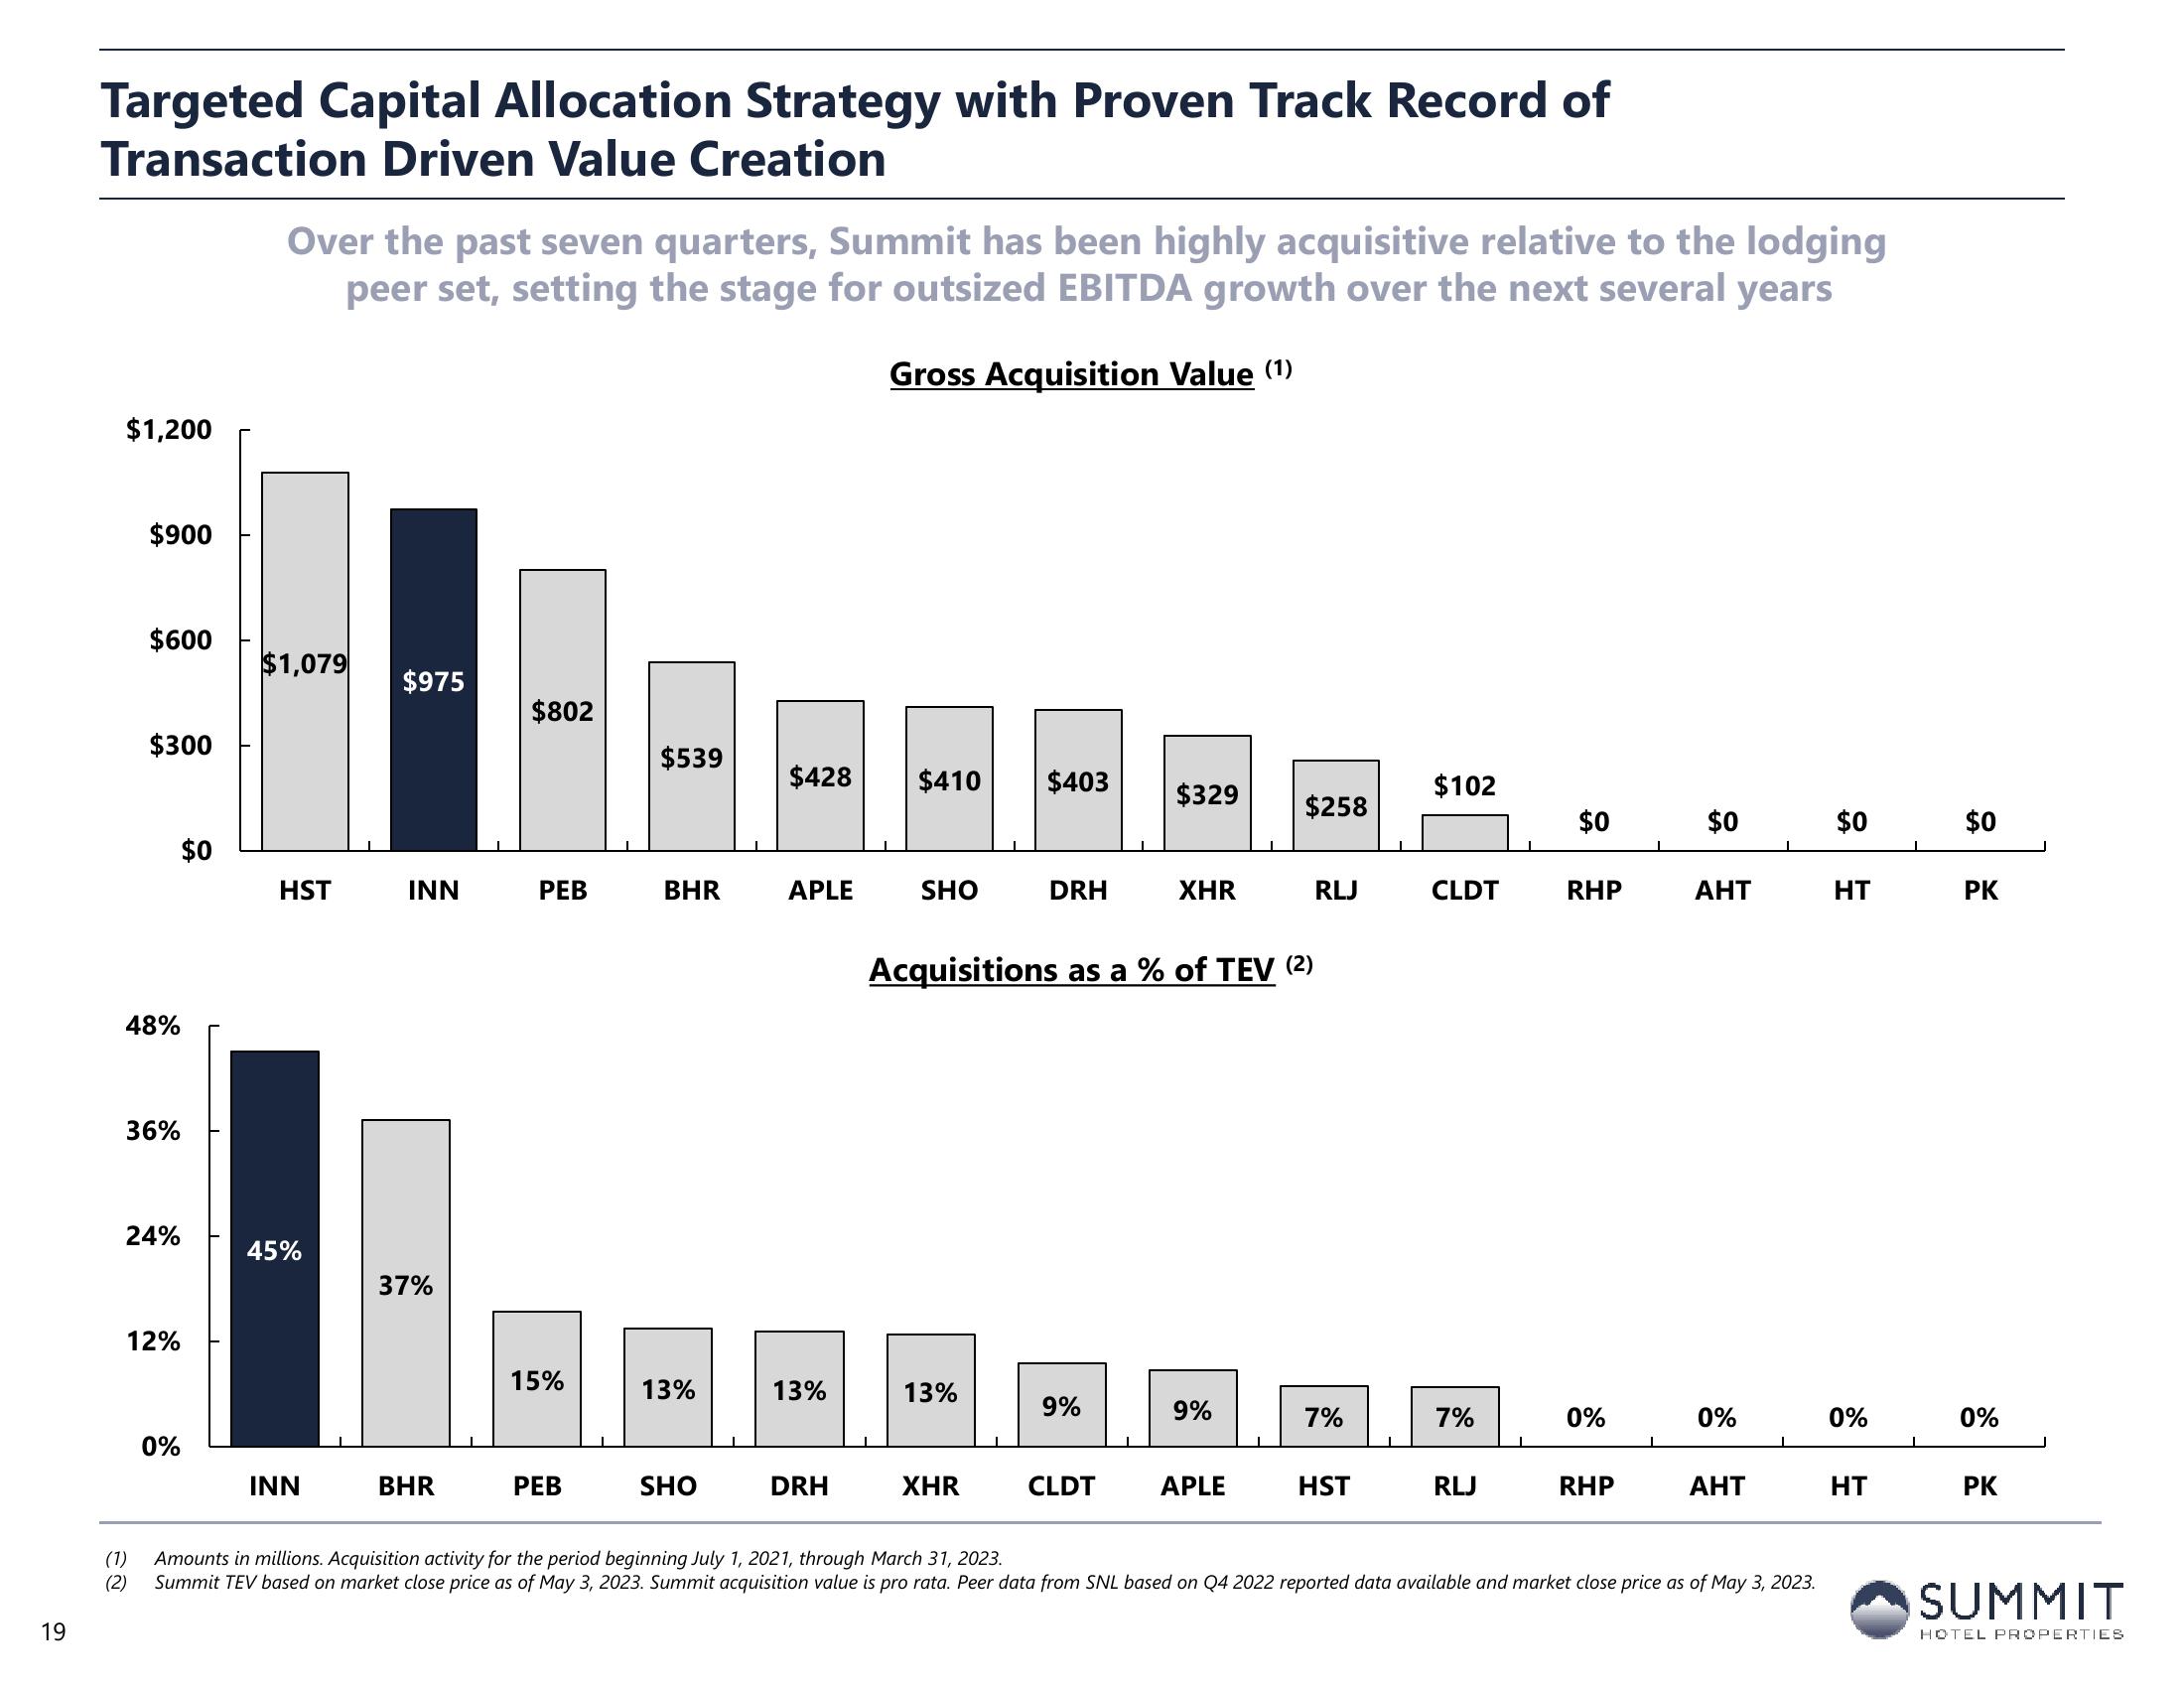
Over the past seven quarters, Summit has been highly acquisitive relative to the lodging
peer set, setting the stage for outsized EBITDA growth over the next several years
Gross Acquisition Value (¹)
$1,079
HST
45%
INN
$975
INN
37%
BHR
$802
PEB
15%
PEB
$539
BHR
13%
SHO
$428
APLE
13%
DRH
$410 $403
SHO
13%
DRH
XHR
9%
$329
Acquisitions as a % of TEV (2)
CLDT
XHR
9%
$258
APLE
RLJ
7%
HST
$102
CLDT
7%
RLJ
$0
RHP
0%
RHP
I
$0
AHT
0%
AHT
Amounts in millions. Acquisition activity for the period beginning July 1, 2021, through March 31, 2023.
Summit TEV based on market close price as of May 3, 2023. Summit acquisition value is pro rata. Peer data from SNL based on Q4 2022 reported data available and market close price as of May 3, 2023.
$0
HT
0%
HT
$0
PK
0%
PK
SUMMIT
HOTEL PROPERTIESView entire presentation