OpenText Investor Presentation Deck
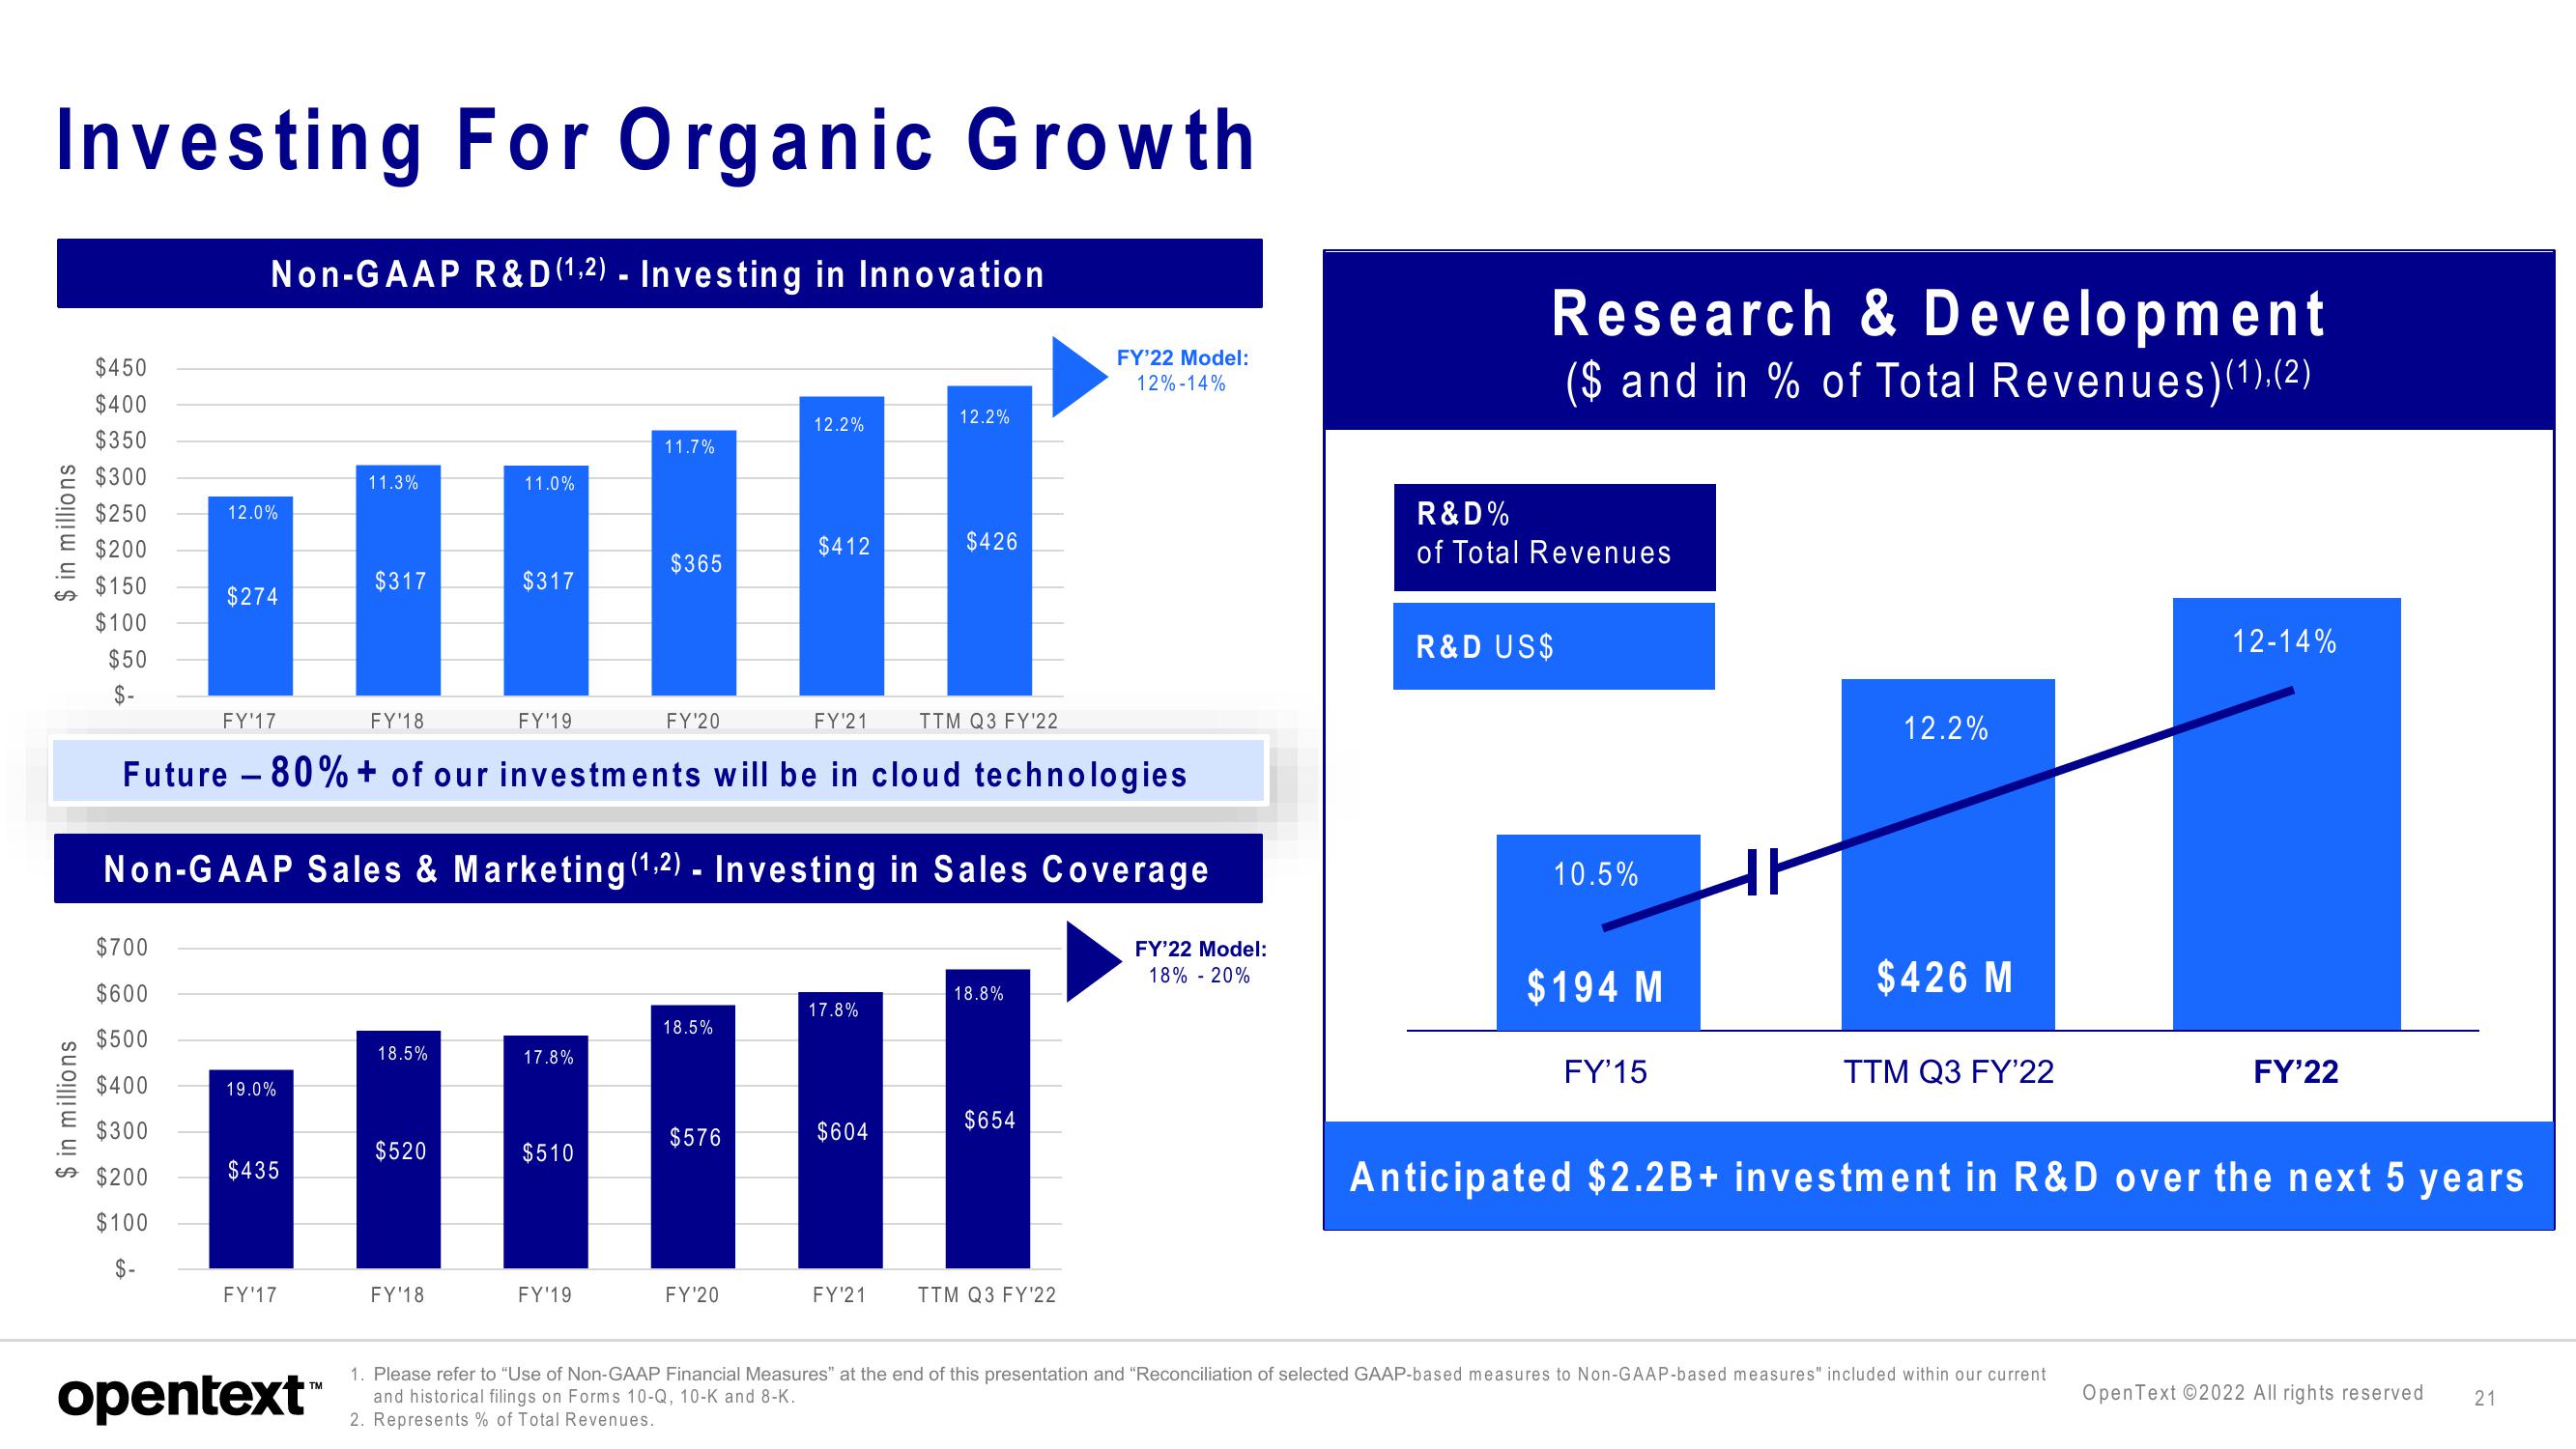
Investing For Organic Growth
$ in millions
$250
E $200
$150
$100
$50
$-
A
$450
$400
$350
$300
$ in millions
Non-GAAP R&D (1,2)- Investing in Innovation
$700
$600
$500
$400
$300
$200
$100
$-
12.0%
$274
19.0%
$435
FY'17
11.3%
opentext™
$317
18.5%
$520
11.0%
FY'18
$317
FY¹17
FY'18
Future - 80%+ of our investments will be in cloud technologies
Non-GAAP Sales & Marketing (1,2)- Investing in Sales Coverage
FY'22 Model:
18% - 20%
FY'19
17.8%
$510
11.7%
FY'19
$365
FY'20
18.5%
$576
12.2%
FY'20
$412
FY¹21
17.8%
$604
12.2%
FY'21
$426
TTM Q3 FY'22
18.8%
$654
FY'22 Model:
12% -14%
TTM Q3 FY'22
Research & Development
($ and in % of Total Revenues)(1).(2)
R&D%
of Total Revenues
R&D US$
10.5%
$194 M
FY'15
12.2%
$426 M
TTM Q3 FY'22
12-14%
1. Please refer to "Use of Non-GAAP Financial Measures" at the end of this presentation and "Reconciliation of selected GAAP-based measures to Non-GAAP-based measures" included within our current
and historical filings on Forms 10-Q, 10-K and 8-K.
2. Represents % of Total Revenues.
FY'22
Anticipated $2.2B+ investment in R&D over the next 5 years
OpenText ©2022 All rights reserved 21View entire presentation