Kymera Investor Presentation Deck
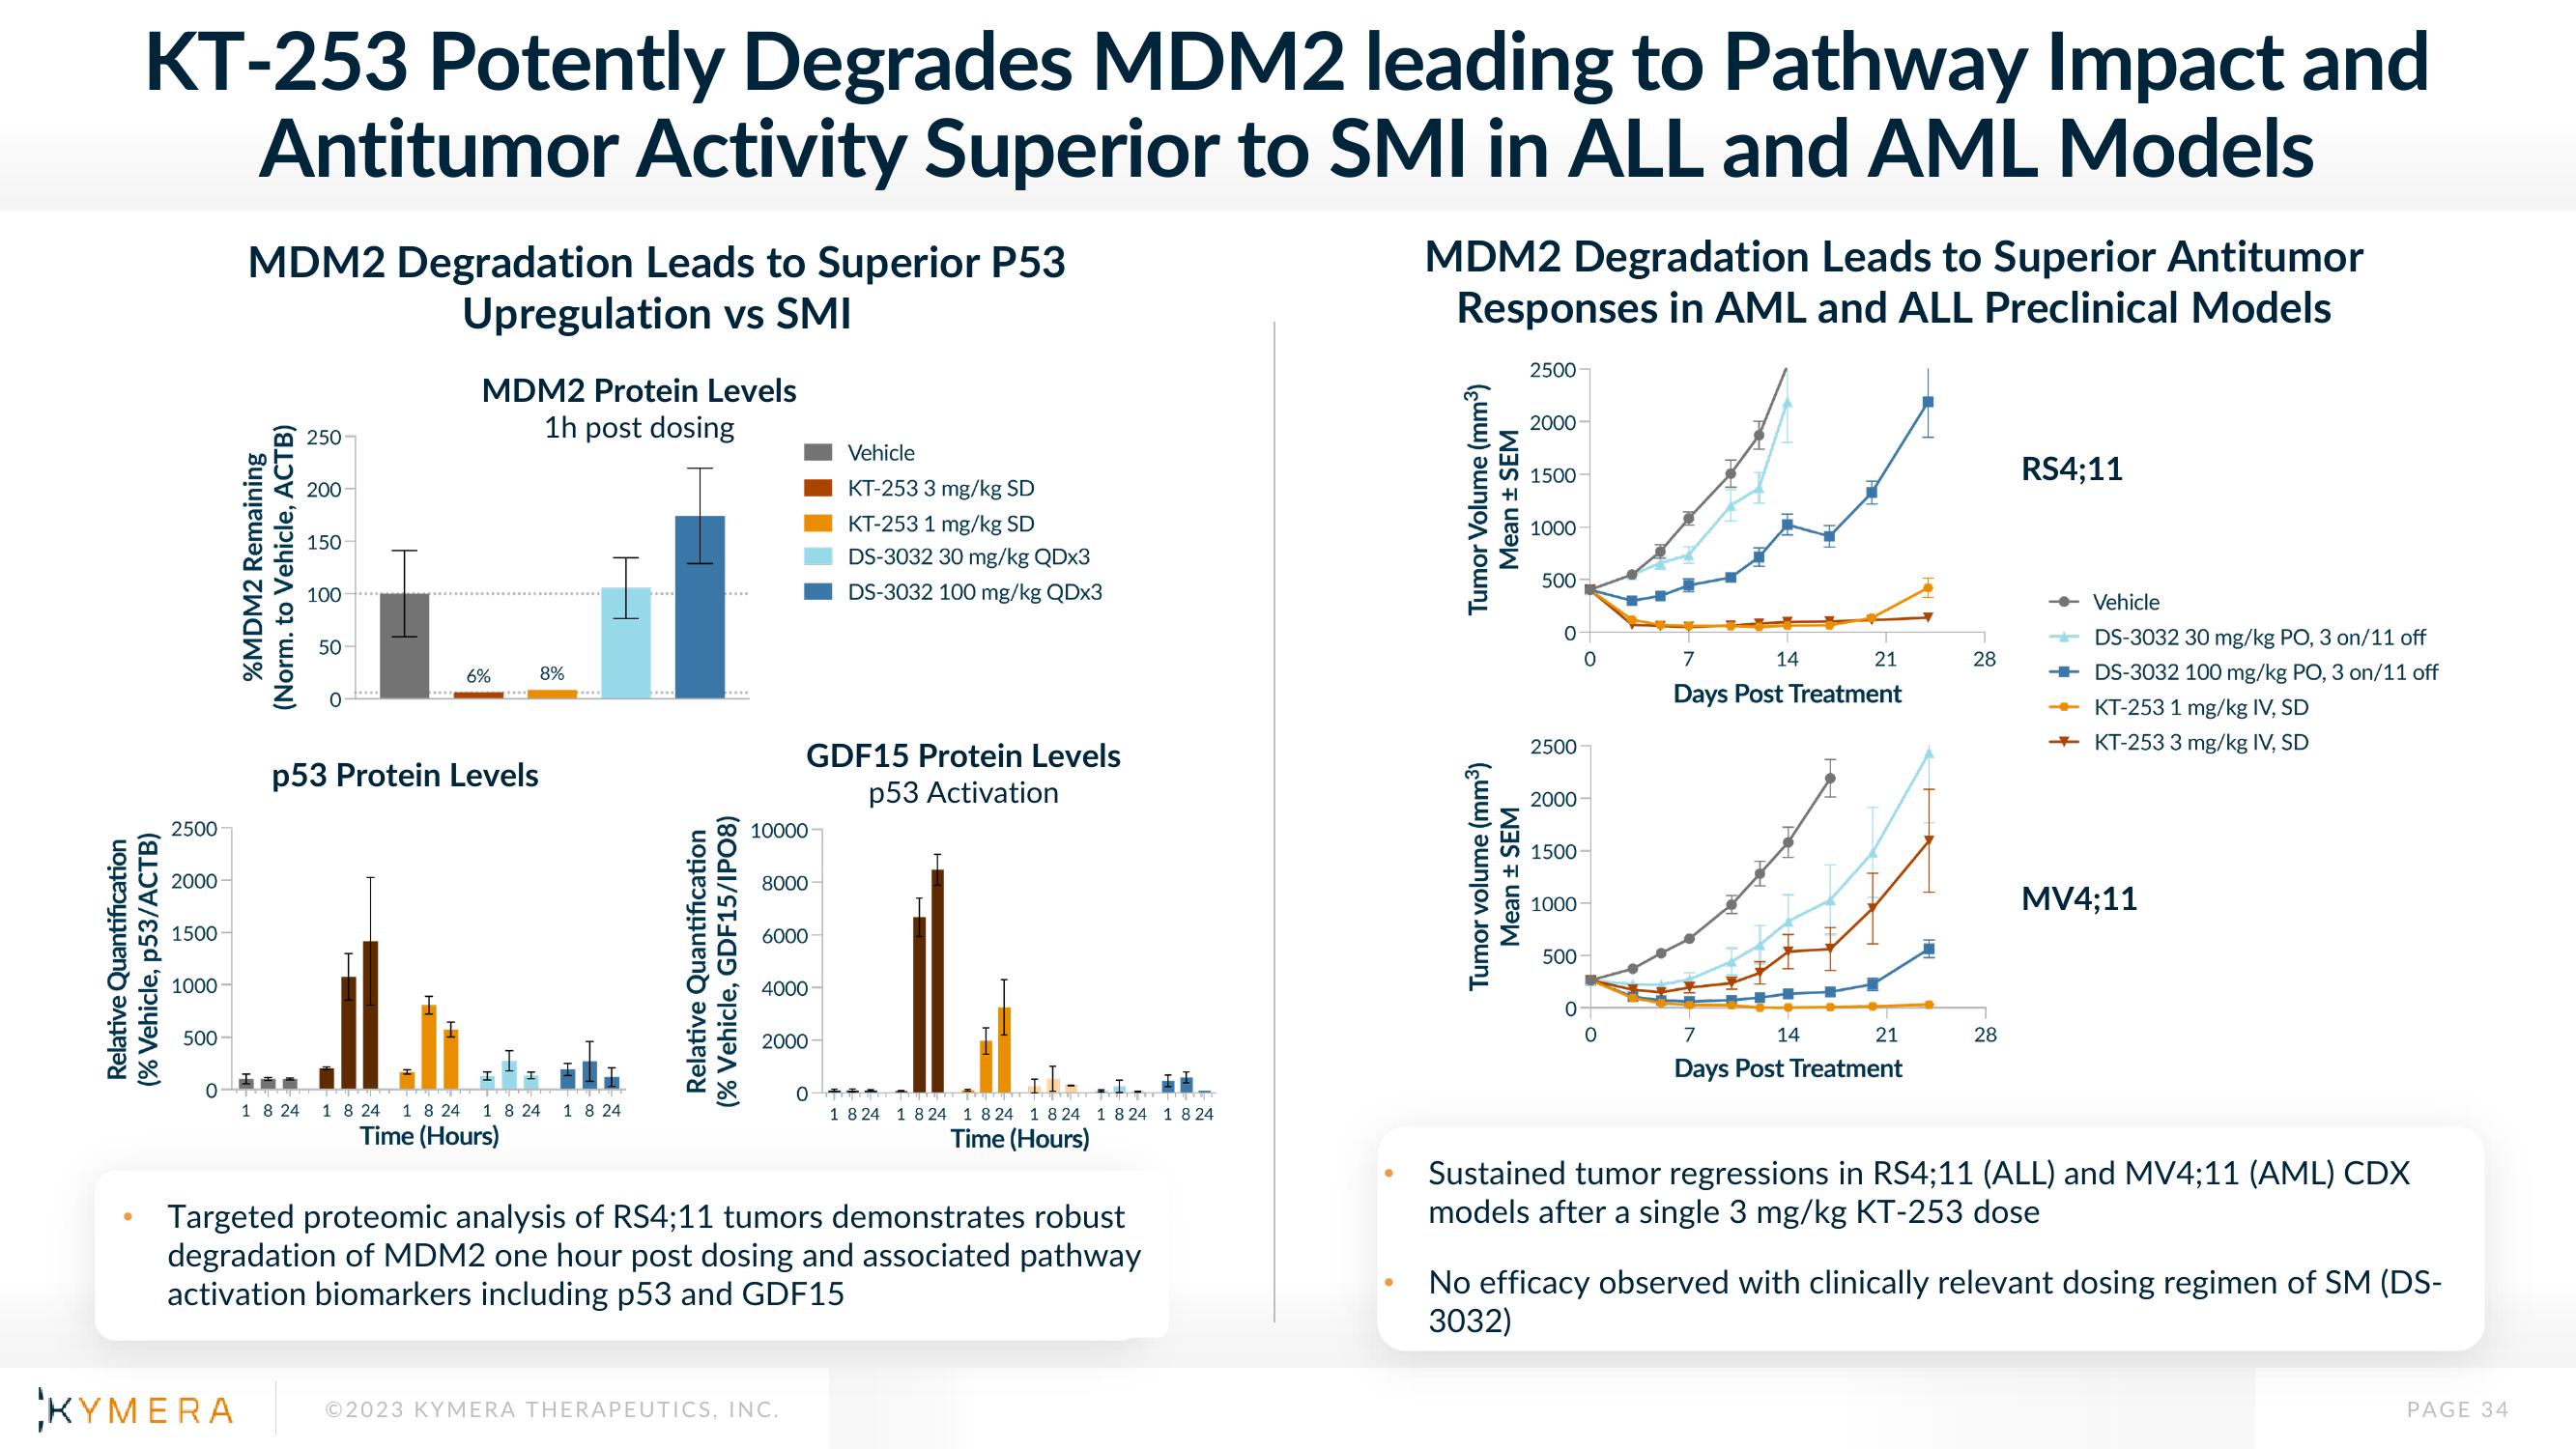
KT-253 Potently Degrades MDM2 leading to Pathway Impact and
Antitumor Activity Superior to SMI in ALL and AML Models
Relative Quantification
(% Vehicle, p53/ACTB)
●
2500
2000
1500-
1000
500
0
MDM2 Degradation Leads to Superior P53
Upregulation vs SMI
KYMERA
%MDM2 Remaining
(Norm. to Vehicle, ACTB)
250
1 8 24
200
150
100
50
0
MDM2 Protein Levels
1h post dosing
6%
p53 Protein Levels
8%
1 8 24 1 8 24 1 8 24 1 8 24
Time (Hours)
Relative Quantification
(% Vehicle, GDF15/IPO8)
10000
8000
6000
GDF15 Protein Levels
p53 Activation
4000
2000
©2023 KYMERA THERAPEUTICS, INC.
Vehicle
KT-253 3 mg/kg SD
KT-253 1 mg/kg SD
DS-3032 30 mg/kg QDx3
DS-3032 100 mg/kg QDx3
0
Targeted proteomic analysis of RS4;11 tumors demonstrates robust
degradation of MDM2 one hour post dosing and associated pathway
activation biomarkers including p53 and GDF15
I
1824 1 824 1 8 24 1 8 24 1 824 1 824
Time (Hours)
MDM2 Degradation Leads to Superior Antitumor
Responses in AML and ALL Preclinical Models
Tumor Volume (mm³)
Mean ± SEM
Tumor volume (mm³)
Mean ± SEM
2500
2000
1500
1000
500
0
2500
2000
1500
1000
500
0
O
14
7
Days Post Treatment
21
7
14
Days Post Treatment
21
28
28
RS4;11
Vehicle
DS-3032 30 mg/kg PO, 3 on/11 off
DS-3032 100 mg/kg PO, 3 on/11 off
→ KT-253 1 mg/kg IV, SD
→KT-253 3 mg/kg IV, SD
MV4;11
Sustained tumor regressions in RS4;11 (ALL) and MV4;11 (AML) CDX
models after a single 3 mg/kg KT-253 dose
No efficacy observed with clinically relevant dosing regimen of SM (DS-
3032)
PAGE 34View entire presentation