GMS Investor Presentation Deck
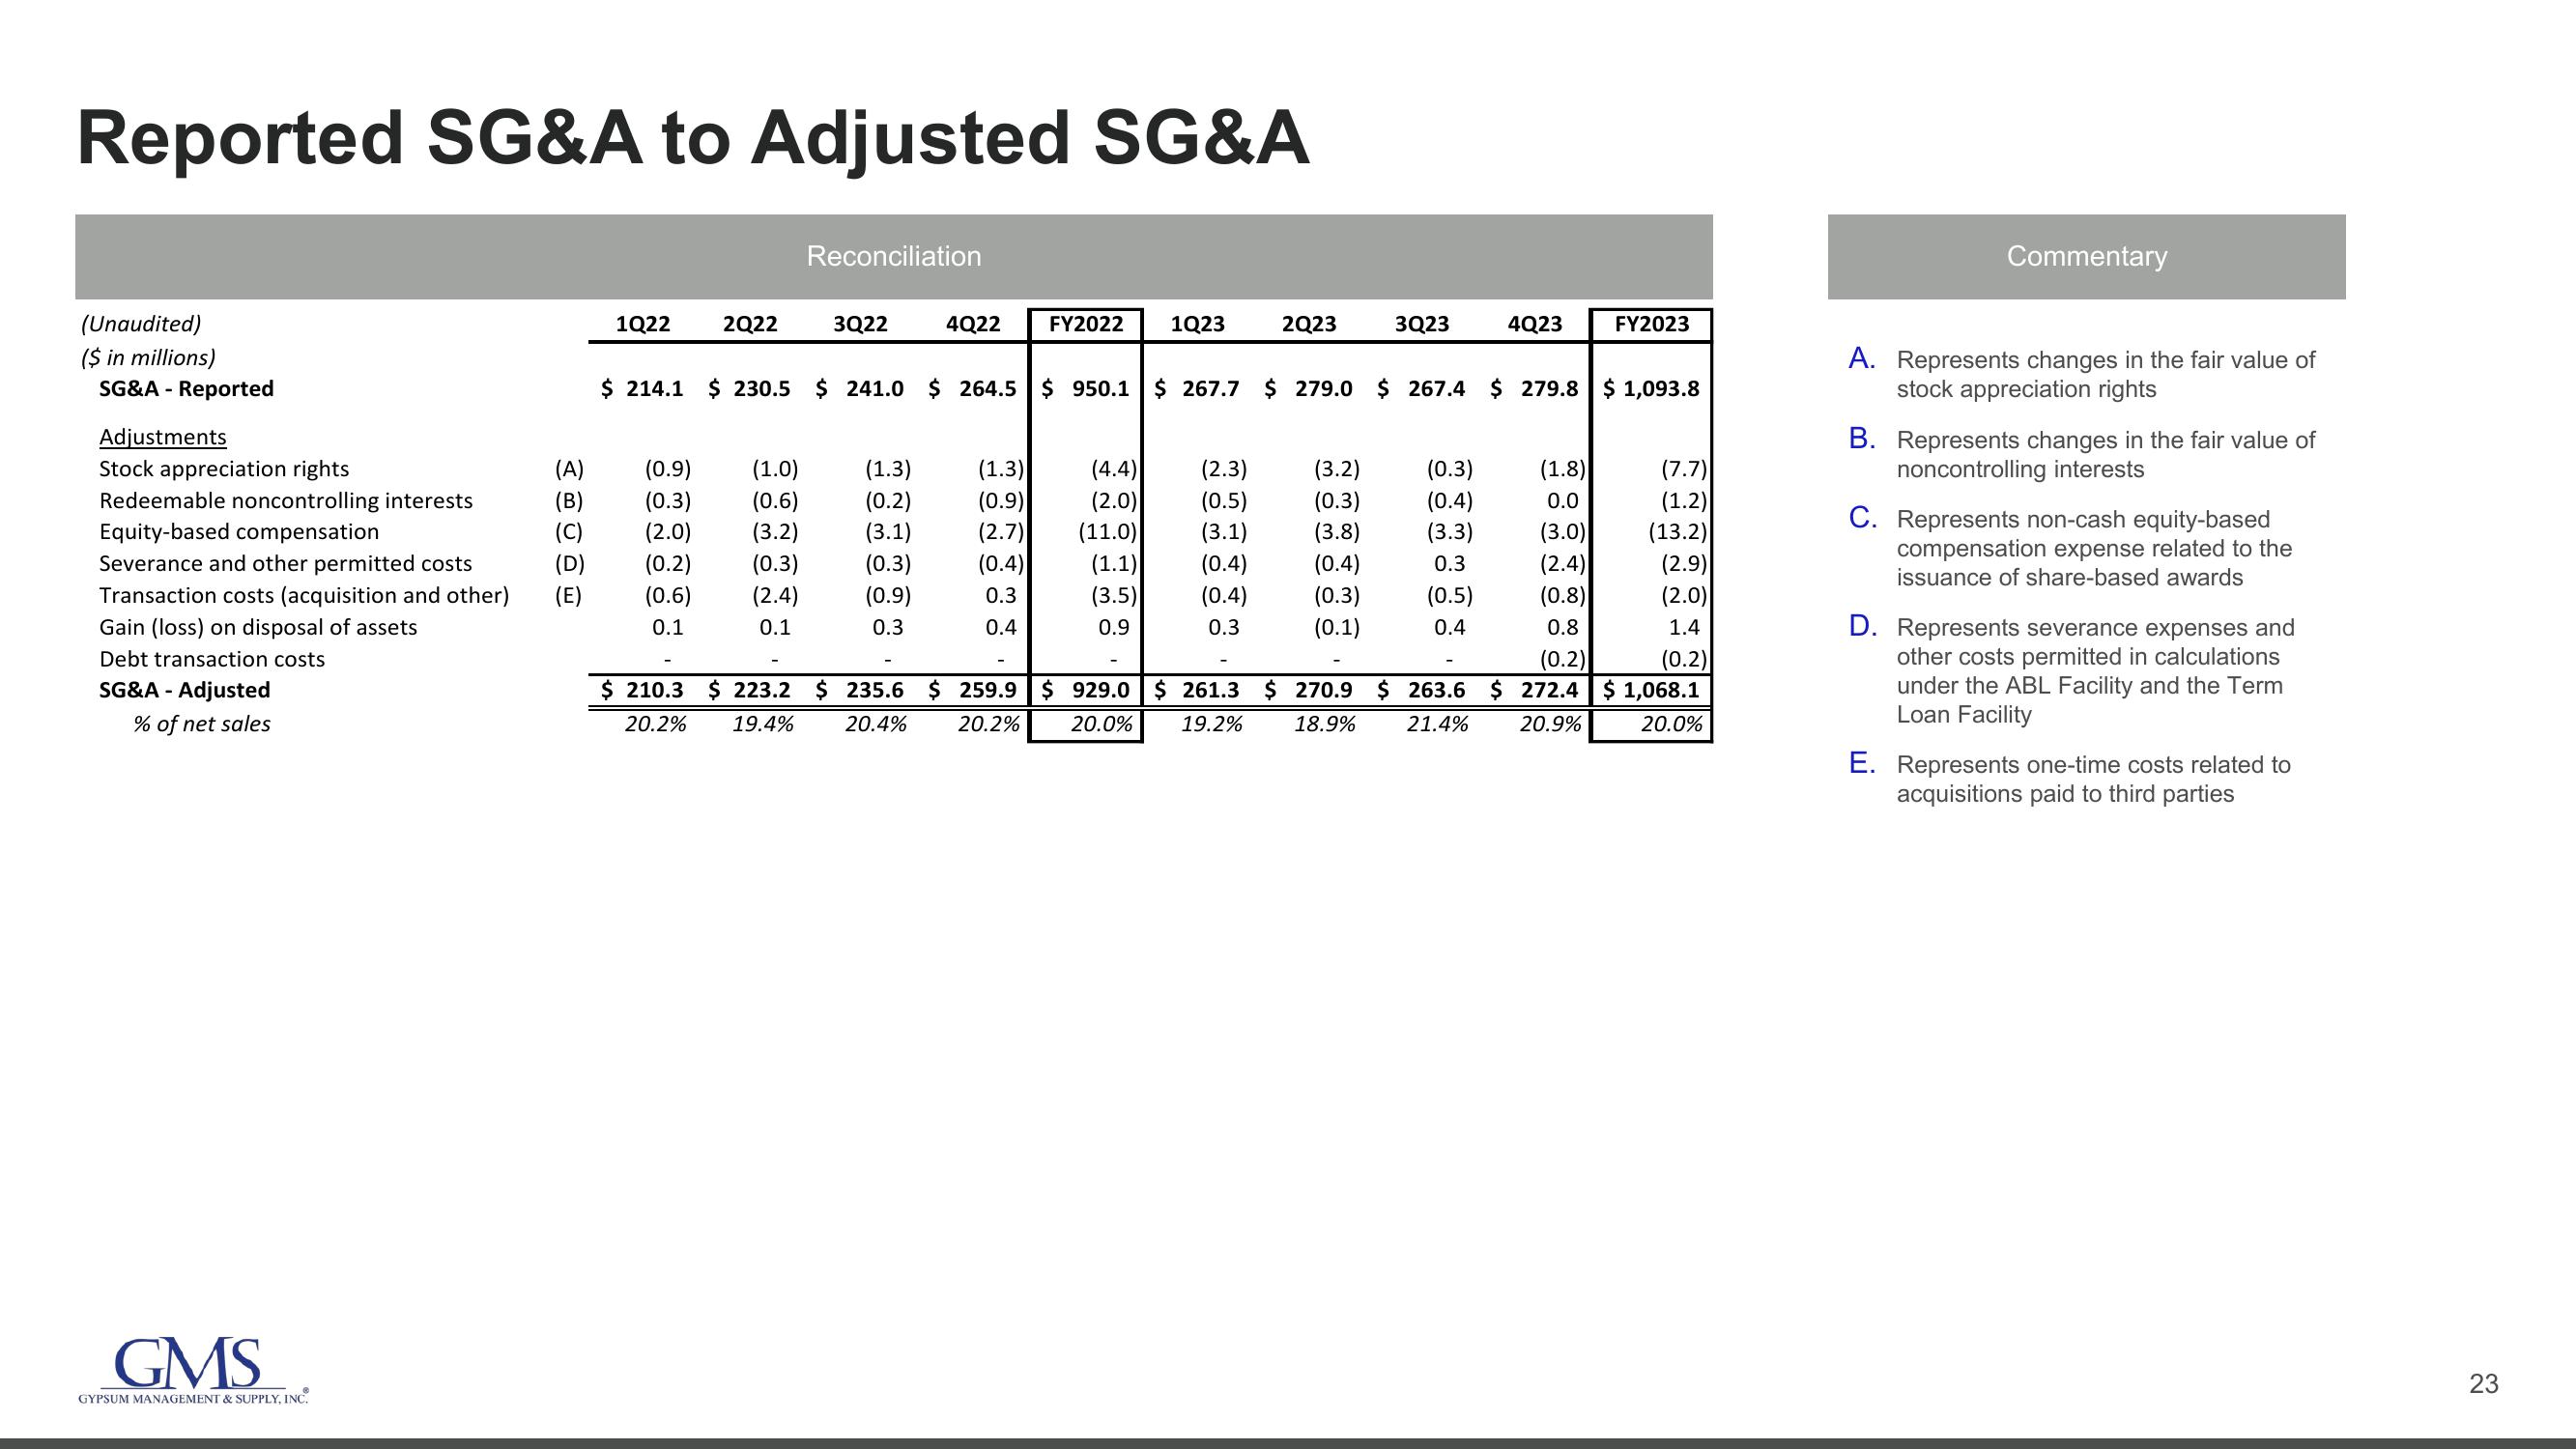
Reported SG&A to Adjusted SG&A
(Unaudited)
($ in millions)
SG&A - Reported
Adjustments
Stock appreciation rights
Redeemable noncontrolling interests
Equity-based compensation
Severance and other permitted costs
Transaction costs (acquisition and other)
Gain (loss) on disposal of assets
Debt transaction costs
SG&A - Adjusted
% of net sales
GMS
GYPSUM MANAGEMENT & SUPPLY, INC.
(A)
(B)
(E)
1Q22
2Q22
(0.9)
(1.0)
(0.3) (0.6)
(2.0)
(3.2)
(0.2)
(0.3)
(0.6)
(2.4)
0.1
0.1
$ 210.3
20.2%
Reconciliation
3Q22
$ 214.1 $ 230.5 $ 241.0 $ 264.5
(1.3)
(0.2)
(3.1)
4Q22 FY2022 1Q23
(0.3)
(0.9)
0.3
(1.3)
(0.9)
(2.7)
(0.4)
0.3
0.4
(4.4) (2.3)
(2.0)
(0.5)
(11.0)
(3.1)
(1.1)
(0.4)
(3.5) (0.4)
0.9
0.3
2Q23
$223.2 $235.6 $ 259.9 $ 929.0
19.4% 20.4% 20.2%
20.0%
3Q23
$ 950.1 $ 267.7 $ 279.0 $267.4 $ 279.8 $ 1,093.8
(3.2)
(0.3)
(3.8)
(0.4)
(0.3)
(0.1)
(0.3)
(0.4)
(3.3)
0.3
(0.5)
0.4
4Q23
$ 261.3 $ 270.9 $ 263.6
19.2% 18.9% 21.4%
FY2023
(1.8)
(7.7)
(1.2)
0.0
(3.0)
(13.2)
(2.4)
(2.9)
(0.8)
(2.0)
1.4
0.8
(0.2)
(0.2)
$ 272.4 $1,068.1
20.9%
20.0%
Commentary
A. Represents changes in the fair value of
stock appreciation rights
B. Represents changes in the fair value of
noncontrolling interests
C. Represents non-cash equity-based
compensation expense related to the
issuance of share-based awards
D. Represents severance expenses and
other costs permitted in calculations
under the ABL Facility and the Term
Loan Facility
E. Represents one-time costs related to
acquisitions paid to third parties
23View entire presentation