Elms SPAC Presentation Deck
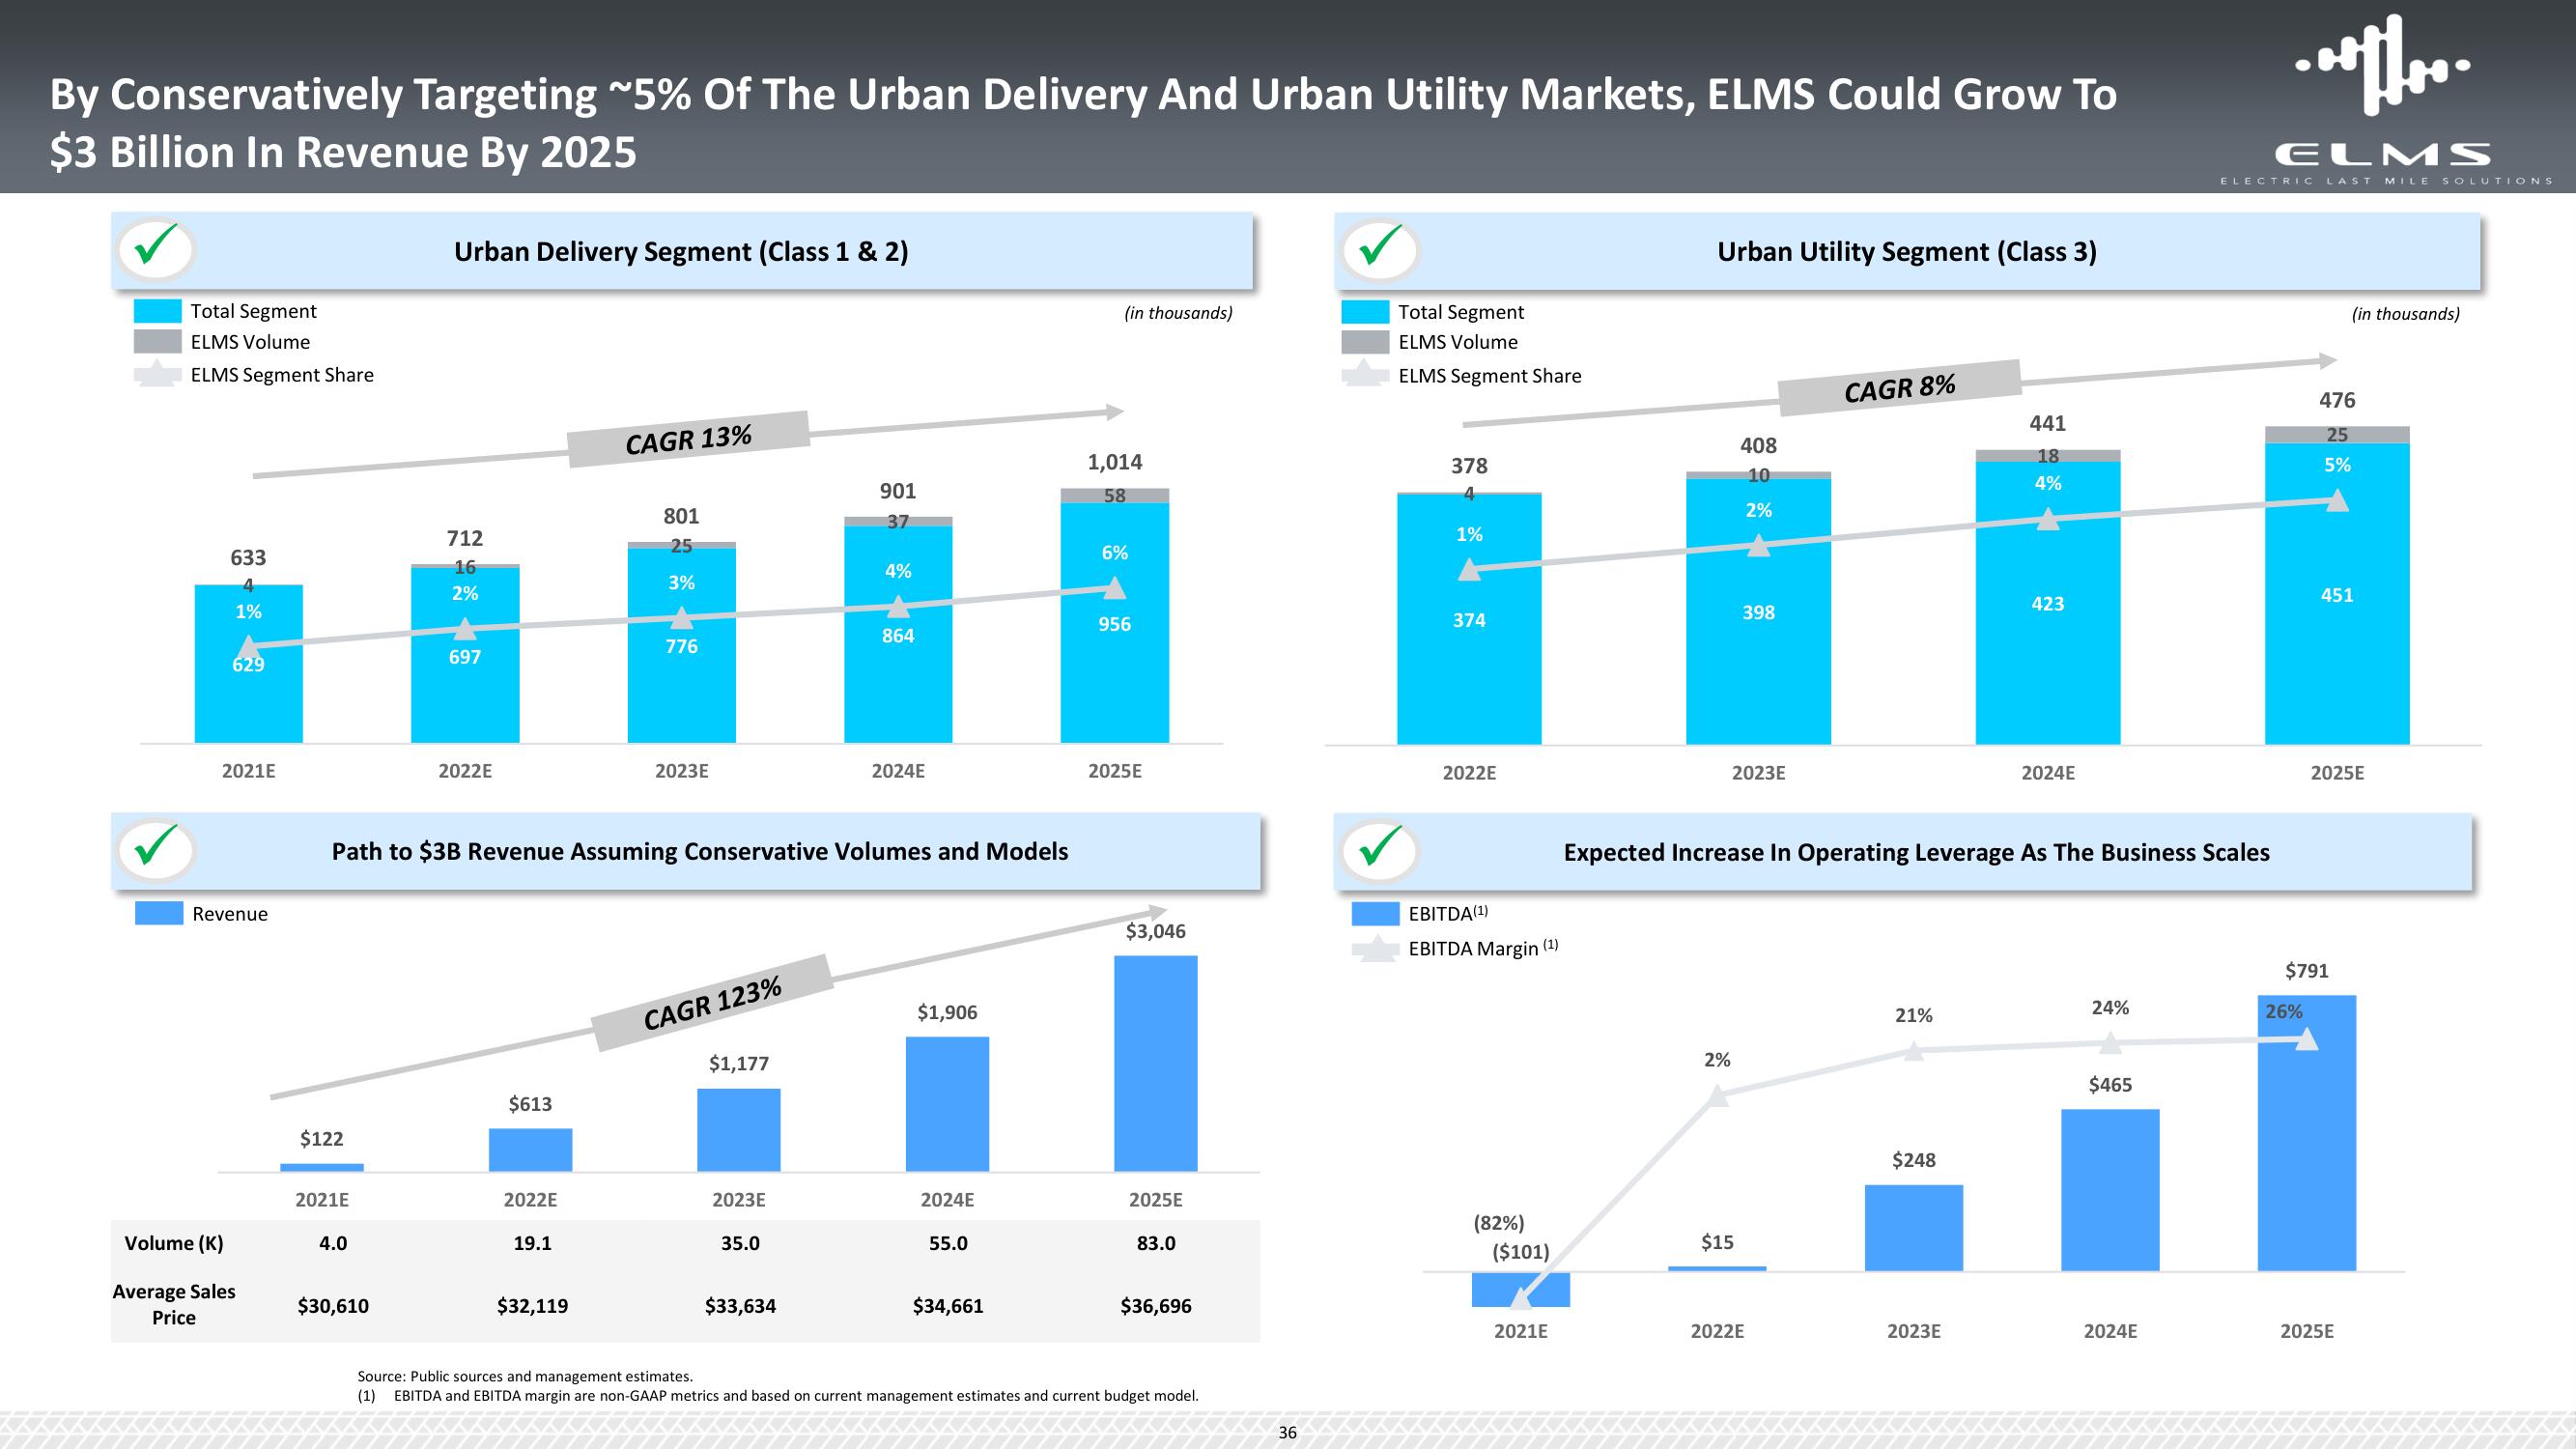
By Conservatively Targeting ~5% Of The Urban Delivery And Urban Utility Markets, ELMS Could Grow To
$3 Billion In Revenue By 2025
Total Segment
ELMS Volume
ELMS Segment Share
633
4
1%
629
2021E
Revenue
Volume (K)
Average Sales
Price
$122
2021E
4.0
Urban Delivery Segment (Class 1 & 2)
$30,610
712
16
2%
697
2022E
$613
2022E
19.1
CAGR 13%
Path to $3B Revenue Assuming Conservative Volumes and Models
$32,119
801
25
3%
776
2023E
CAGR 123%
$1,177
2023E
35.0
901
37
$33,634
4%
864
2024E
$1,906
2024E
55.0
$34,661
(in thousands)
1,014
58
6%
956
2025E
$3,046
2025E
83.0
$36,696
Source: Public sources and management estimates.
(1) EBITDA and EBITDA margin are non-GAAP metrics and based on current management estimates and current budget model.
36
Total Segment
ELMS Volume
ELMS Segment Share
378
4
1%
374
2022E
EBITDA (¹)
EBITDA Margin (¹)
(82%)
($101)
2021E
Urban Utility Segment (Class 3)
2%
408
10
2%
398
2023E
$15
CAGR 8%
2022E
Expected Increase In Operating Leverage As The Business Scales
21%
$248
441
18
4%
2023E
423
2024E
24%
$465
2024E
.....
ELMS
ELECTRIC LAST MILE SOLUTIONS
26%
476
25
5%
(in thousands)
451
$791
2025E
2025EView entire presentation