sndl Investor Presentation
Tilray Brands, Inc.
Cronos Group Inc.
Canopy Growth Corporation
Aurora Cannabis Inc.
OrganiGram Holdings Inc.
Village Farms International, Inc.
Average
Median
SNDL Inc.¹
Balance Sheet
COMPARABLE VALUATION ANALYSIS
Share Share Mkt
Total
Price Price Cap Debt Cash
US$ /sh C$/sh C$mm C$mm
US$1.43 C$1.98 $536
EV²
C$mm C$mm
US$1.67 C$2.31 $1,731 $706 $404
US$2.07 C$2.86 $1,112
$2,064
$1,161
($69)
$1,146
US$0.52 C$0.72 $608 $724 $270
US$0.47 C$0.65 $320 $56 $215 $256
US$1.24 C$1.72 $140 $0
$53
$93
US$0.66 C$0.91 $101 $73 $49 $147
$202 $526
Net Cash / (Debt) + 30D Avg. Daily Total Cash /
Investments
per FD S/O
Value Traded³
C$ /sh
($0.40)
$2.99
($0.54)
$0.32
$0.19
($0.22)
$2.90
C$mm
$43
$5
$34
$8
$4
$0
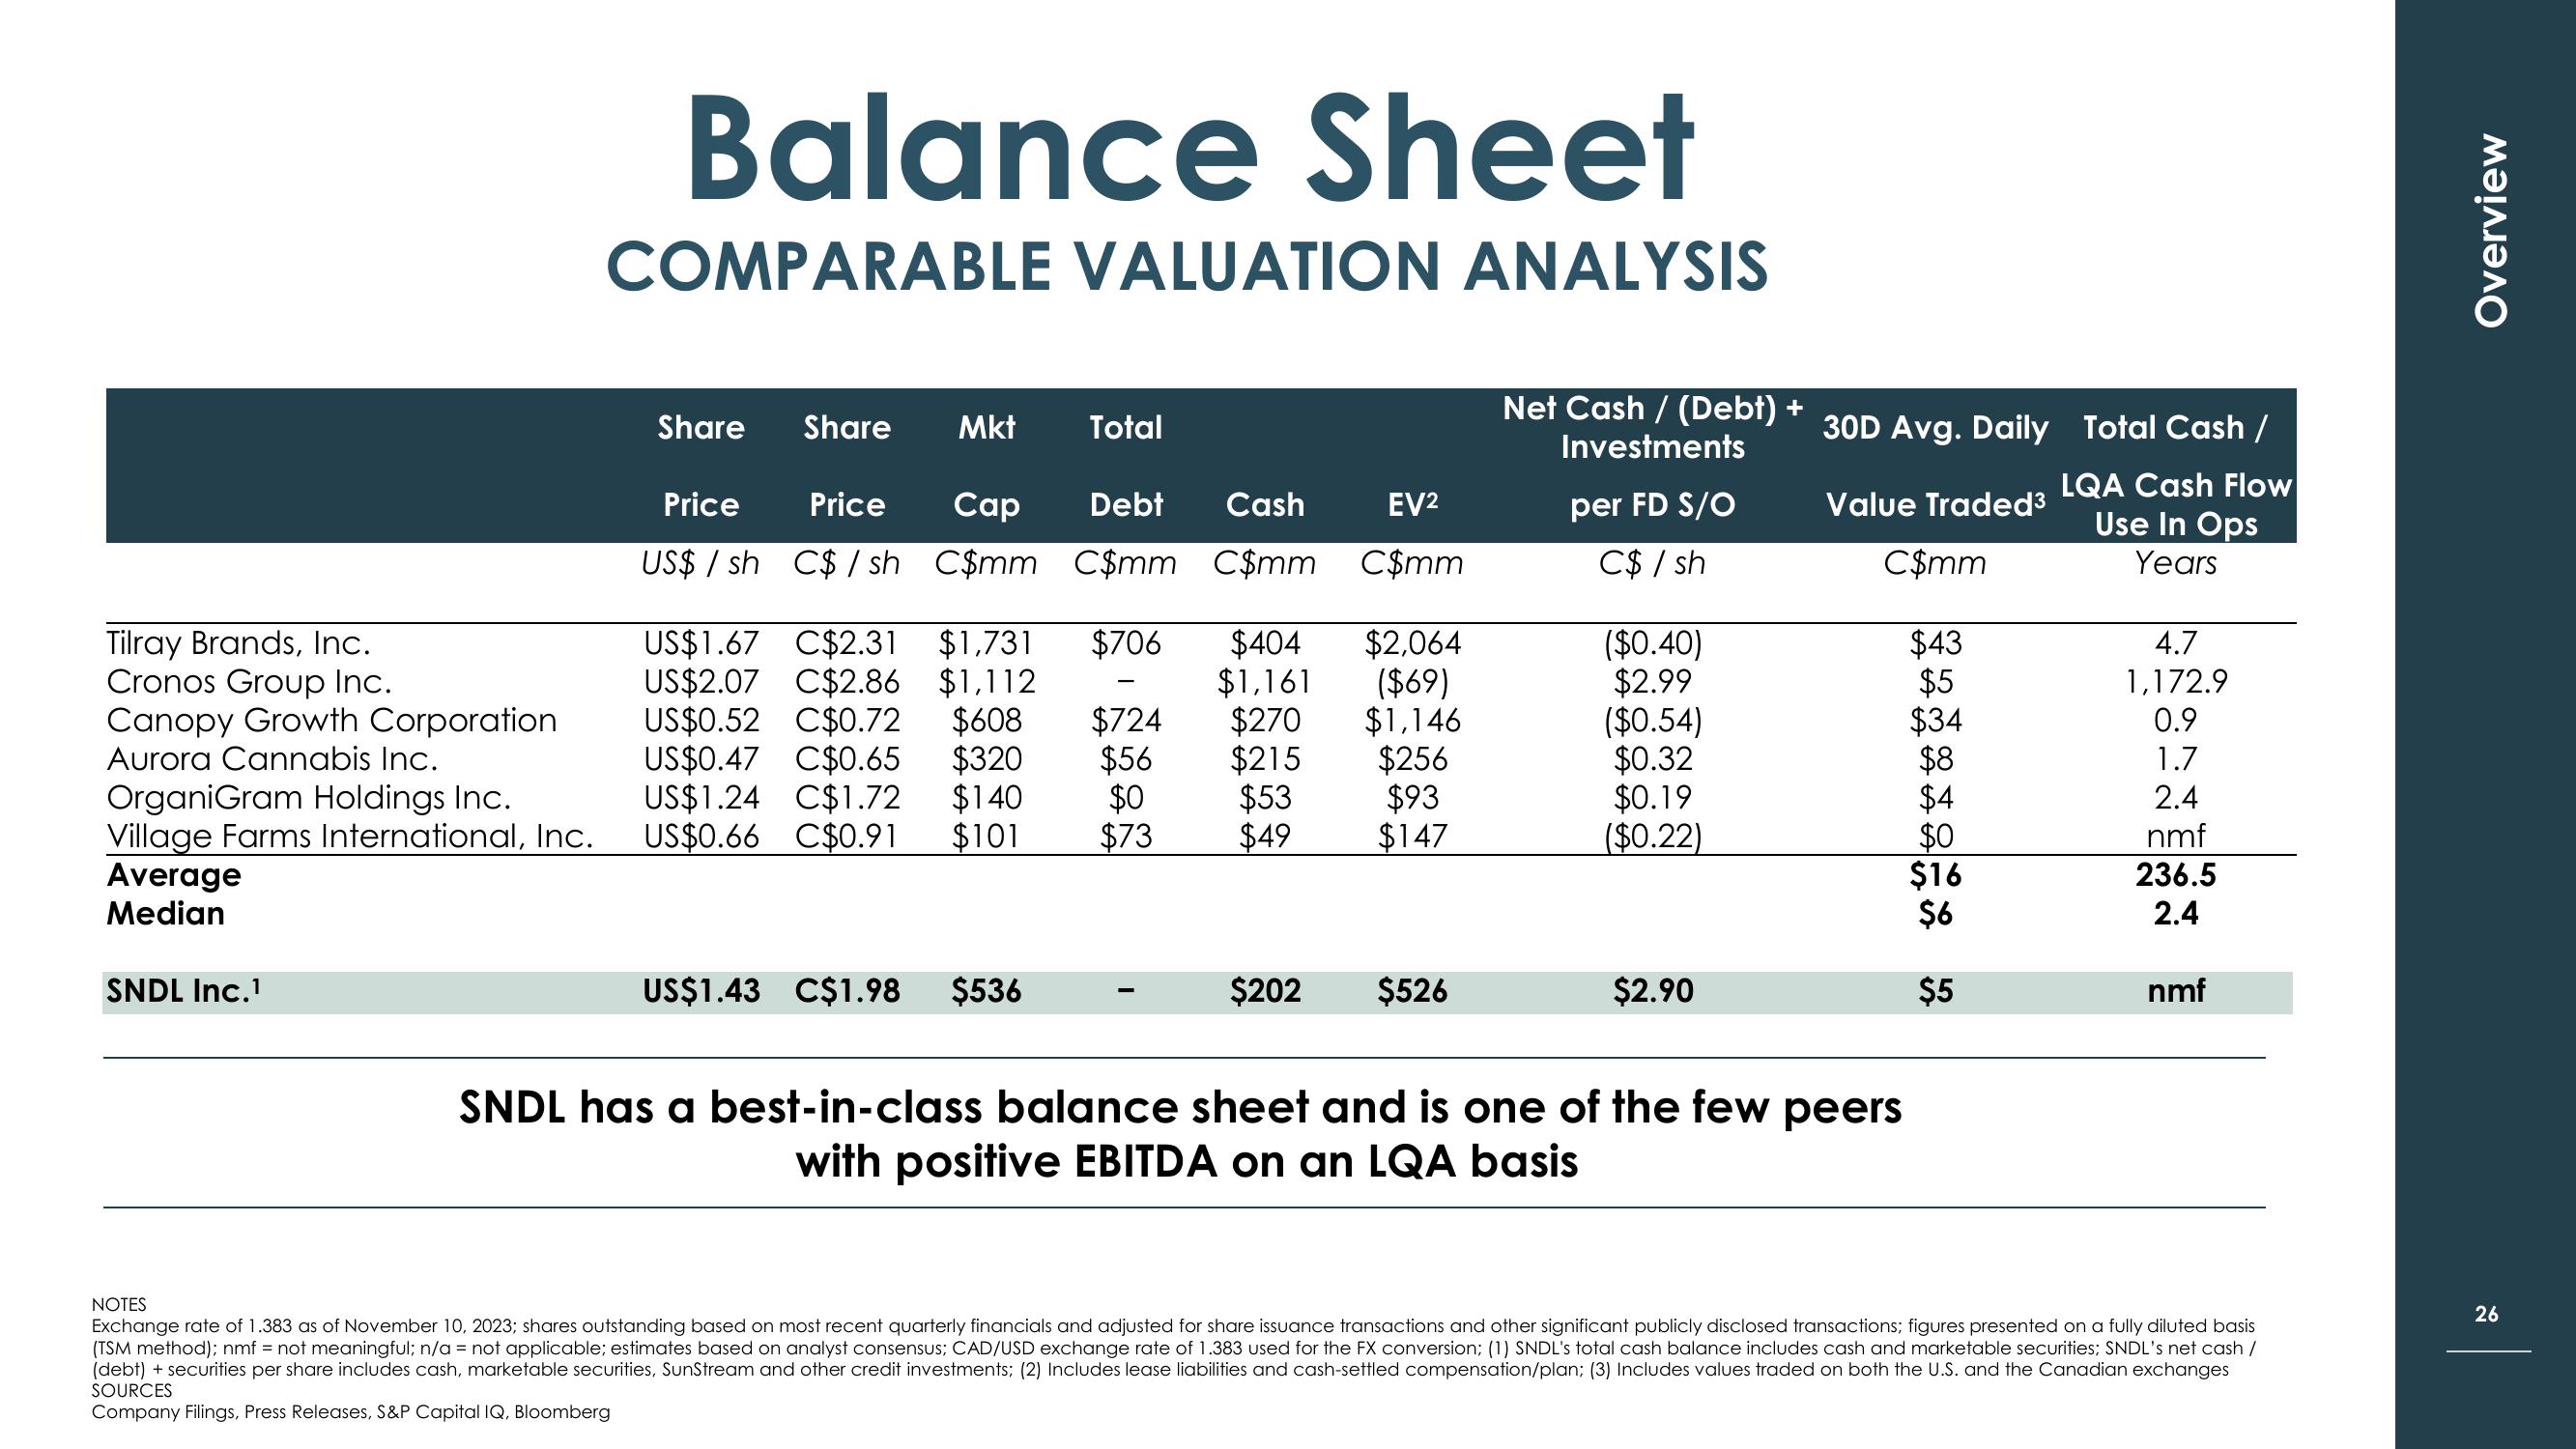
SNDL has a best-in-class balance sheet and is one of the few peers
with positive EBITDA on an LQA basis
$16
$6
$5
LQA Cash Flow
Use In Ops
Years
4.7
1,172.9
0.9
1.7
2.4
nmf
236.5
2.4
nmf
NOTES
Exchange rate of 1.383 as of November 10, 2023; shares outstanding based on most recent quarterly financials and adjusted for share issuance transactions and other significant publicly disclosed transactions; figures presented on a fully diluted basis
(TSM method); nmf = not meaningful; n/a = not applicable; estimates based on analyst consensus; CAD/USD exchange rate of 1.383 used for the FX conversion; (1) SNDL's total cash balance includes cash and marketable securities; SNDL's net cash /
(debt) + securities per share includes cash, marketable securities, SunStream and other credit investments; (2) Includes lease liabilities and cash-settled compensation/plan; (3) Includes values traded on both the U.S. and the Canadian exchanges
SOURCES
Company Filings, Press Releases, S&P Capital IQ, Bloomberg
Overview
26View entire presentation