Bank of America Investment Banking Pitch Book
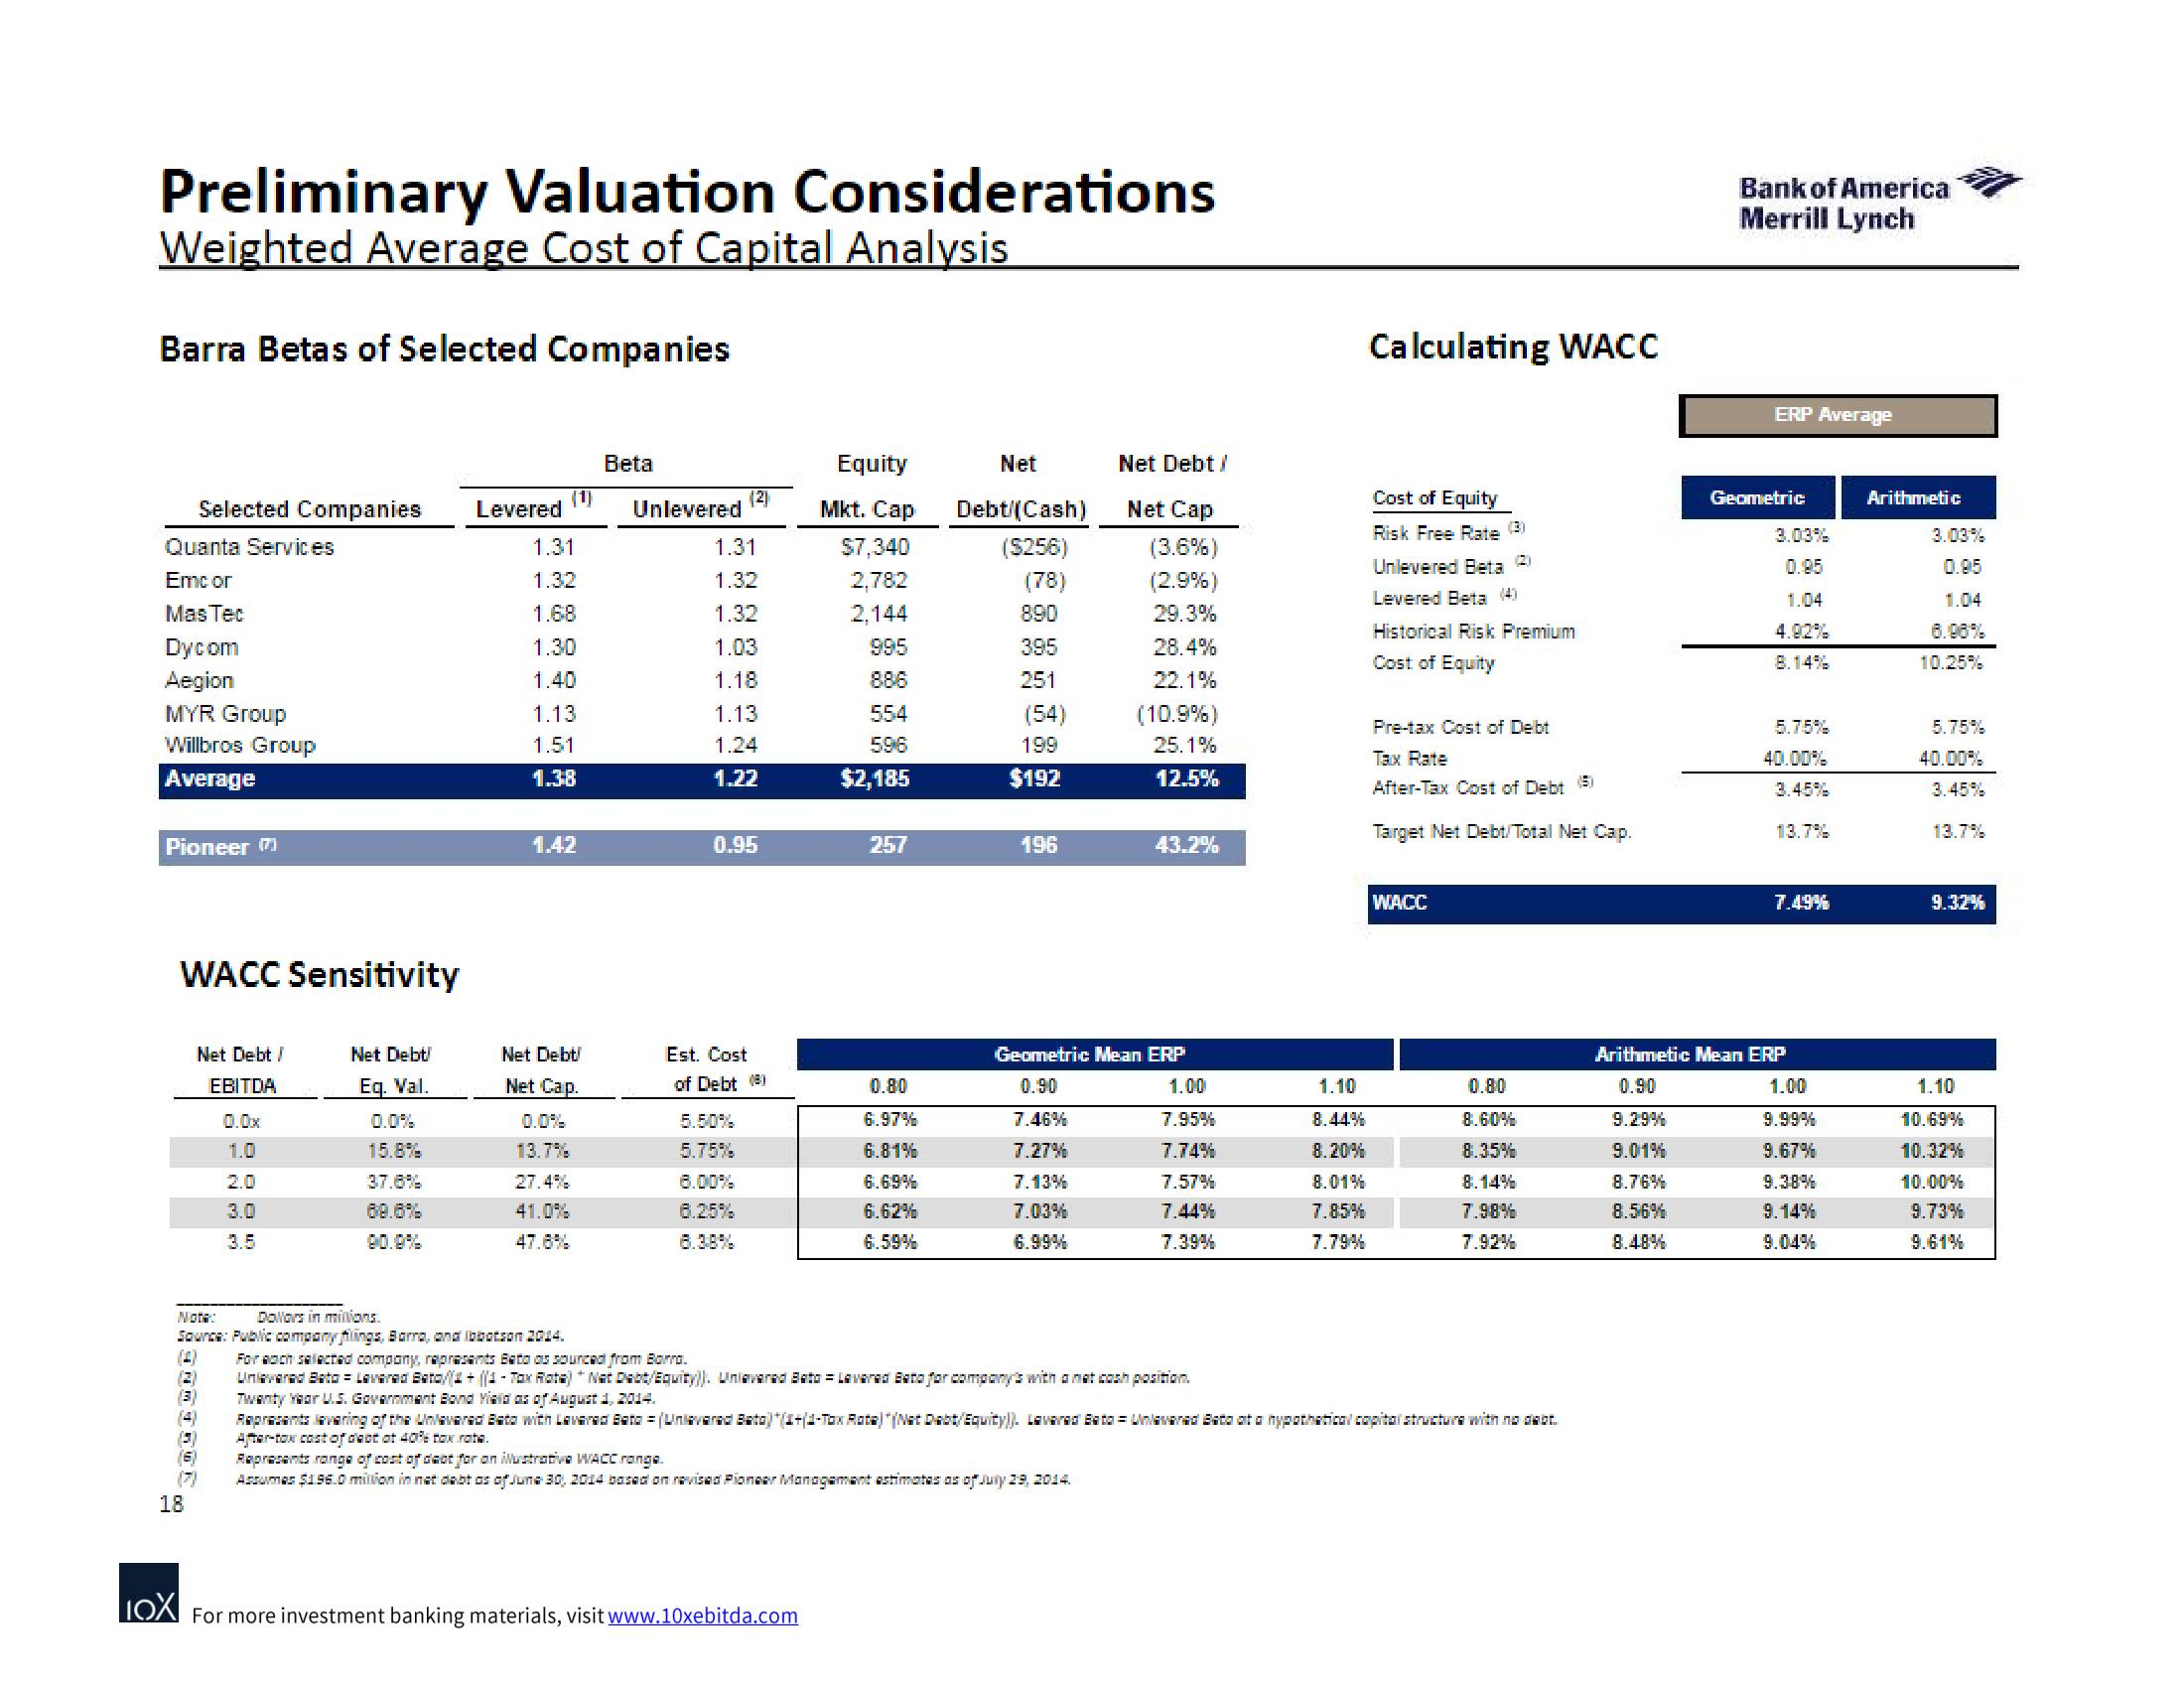
Preliminary Valuation Considerations
Weighted Average Cost of Capital Analysis
Barra Betas of Selected Companies
Quanta Services
Emcor
Mas Tec
Dycom
Aegion
MYR Group
Willbros Group
Average
Pioneer
Selected Companies Levered
WACC Sensitivity
Net Debt /
EBITDA
0.0x
(3)
(3)
(5)
(6)
(7)
18
3.0
Net Debt!
Eq. Val.
0.0%
15.8%
37.6%
68.6%
(1)
1.31
1.32
1.68
1.30
1.40
1.13
1.51
1.38
1.42
Net Debt!
Net Cap.
13.7%
27.4%
41.0%
47.8%
Beta
Unlevered
(2)
1.31
1.32
1.32
1.03
1.18
1.13
1.24
1.22
0.95
Est. Cost
of Debt (8)
5.50%
5.75%
6.00%
6.25%
Equity
Mkt. Cap
$7,340
2,782
2,144
995
886
554
596
$2,185
257
0.80
6.97%
6.81%
6.69%
6.62%
6.59%
IOX For more investment banking materials, visit www.10xebitda.com
Net
Debt/(Cash)
($256)
(78)
890
395
251
(54)
199
$192
196
7.46%
7.27%
7.13%
7.03%
6.99%
Nota:
Dollars in millions.
Source: Public company filings, Barra, and Ibbotson 2014.
(4) For each selected company, represents Bata as sourced from Barra.
Unlevered Bato = Lavared Bato(1 + ((4- Tox Rota) * Nat Dabt/Equity)). Uniavared Bato Lavared Bato for company's with a net cash position.
Twenty Year U.S. Government Bond Yield as of August 1, 2014.
Net Debt /
Net Cap
(3.6%)
(2.9%)
29.3%
28.4%
22.1%
(10.9%)
25.1%
12.5%
Geometric Mean ERP
0.90
43.2%
Represents range of cost of det for an ilustrative WACC range.
Assumes $196.0 million in net debt as of June 30, 2014 based on revised Pioneer Management estimates as of July 29, 2014.
1.00
7.95%
7.74%
7.57%
7.44%
7.39%
1.10
8.44%
8.20%
8.01%
7.85%
7.79%
Calculating WACC
Cost of Equity
Risk Free Rate (3)
Unlevered Beta
Levered Beta (4)
Historical Risk Premium
Cost of Equity
Pre-tax Cost of Debt
Tax Rate
After-Tax Cost of Debt (5)
Target Net Debt/Total Net Cap.
WACC
0.80
8.60%
8.35%
Represents levering of the Unlevered Bato with Laverad Bato (Unlevared Bato)*(1+(1-Tox Rota"(Net Diabt/Equity)). Lavarad Bato Unavarad Bata at a hypothetical capital structure with no debt.
After-tax cost of debt at 40% tax rate.
8.14%
7.98%
7.92%
Bank of America
Merrill Lynch
9.29%
9.01%
8.76%
8.56%
8.48%
ERP Average
Geometric
3.03%
0.95
1.04
8.14%
5.75%
40.00%
3.45%
13.7%
7.49%
Arithmetic Mean ERP
0.90
1.00
9.99%
9.67%
9.38%
9.14%
9.04%
Arithmetic
3.03%
0.95
1.04
6.98%
10.25%
5.75%
40.00%
3.45%
13.7%
9.32%
1.10
10.69%
10.32%
10.00%
9.73%
9.61%View entire presentation