UBS Results Presentation Deck
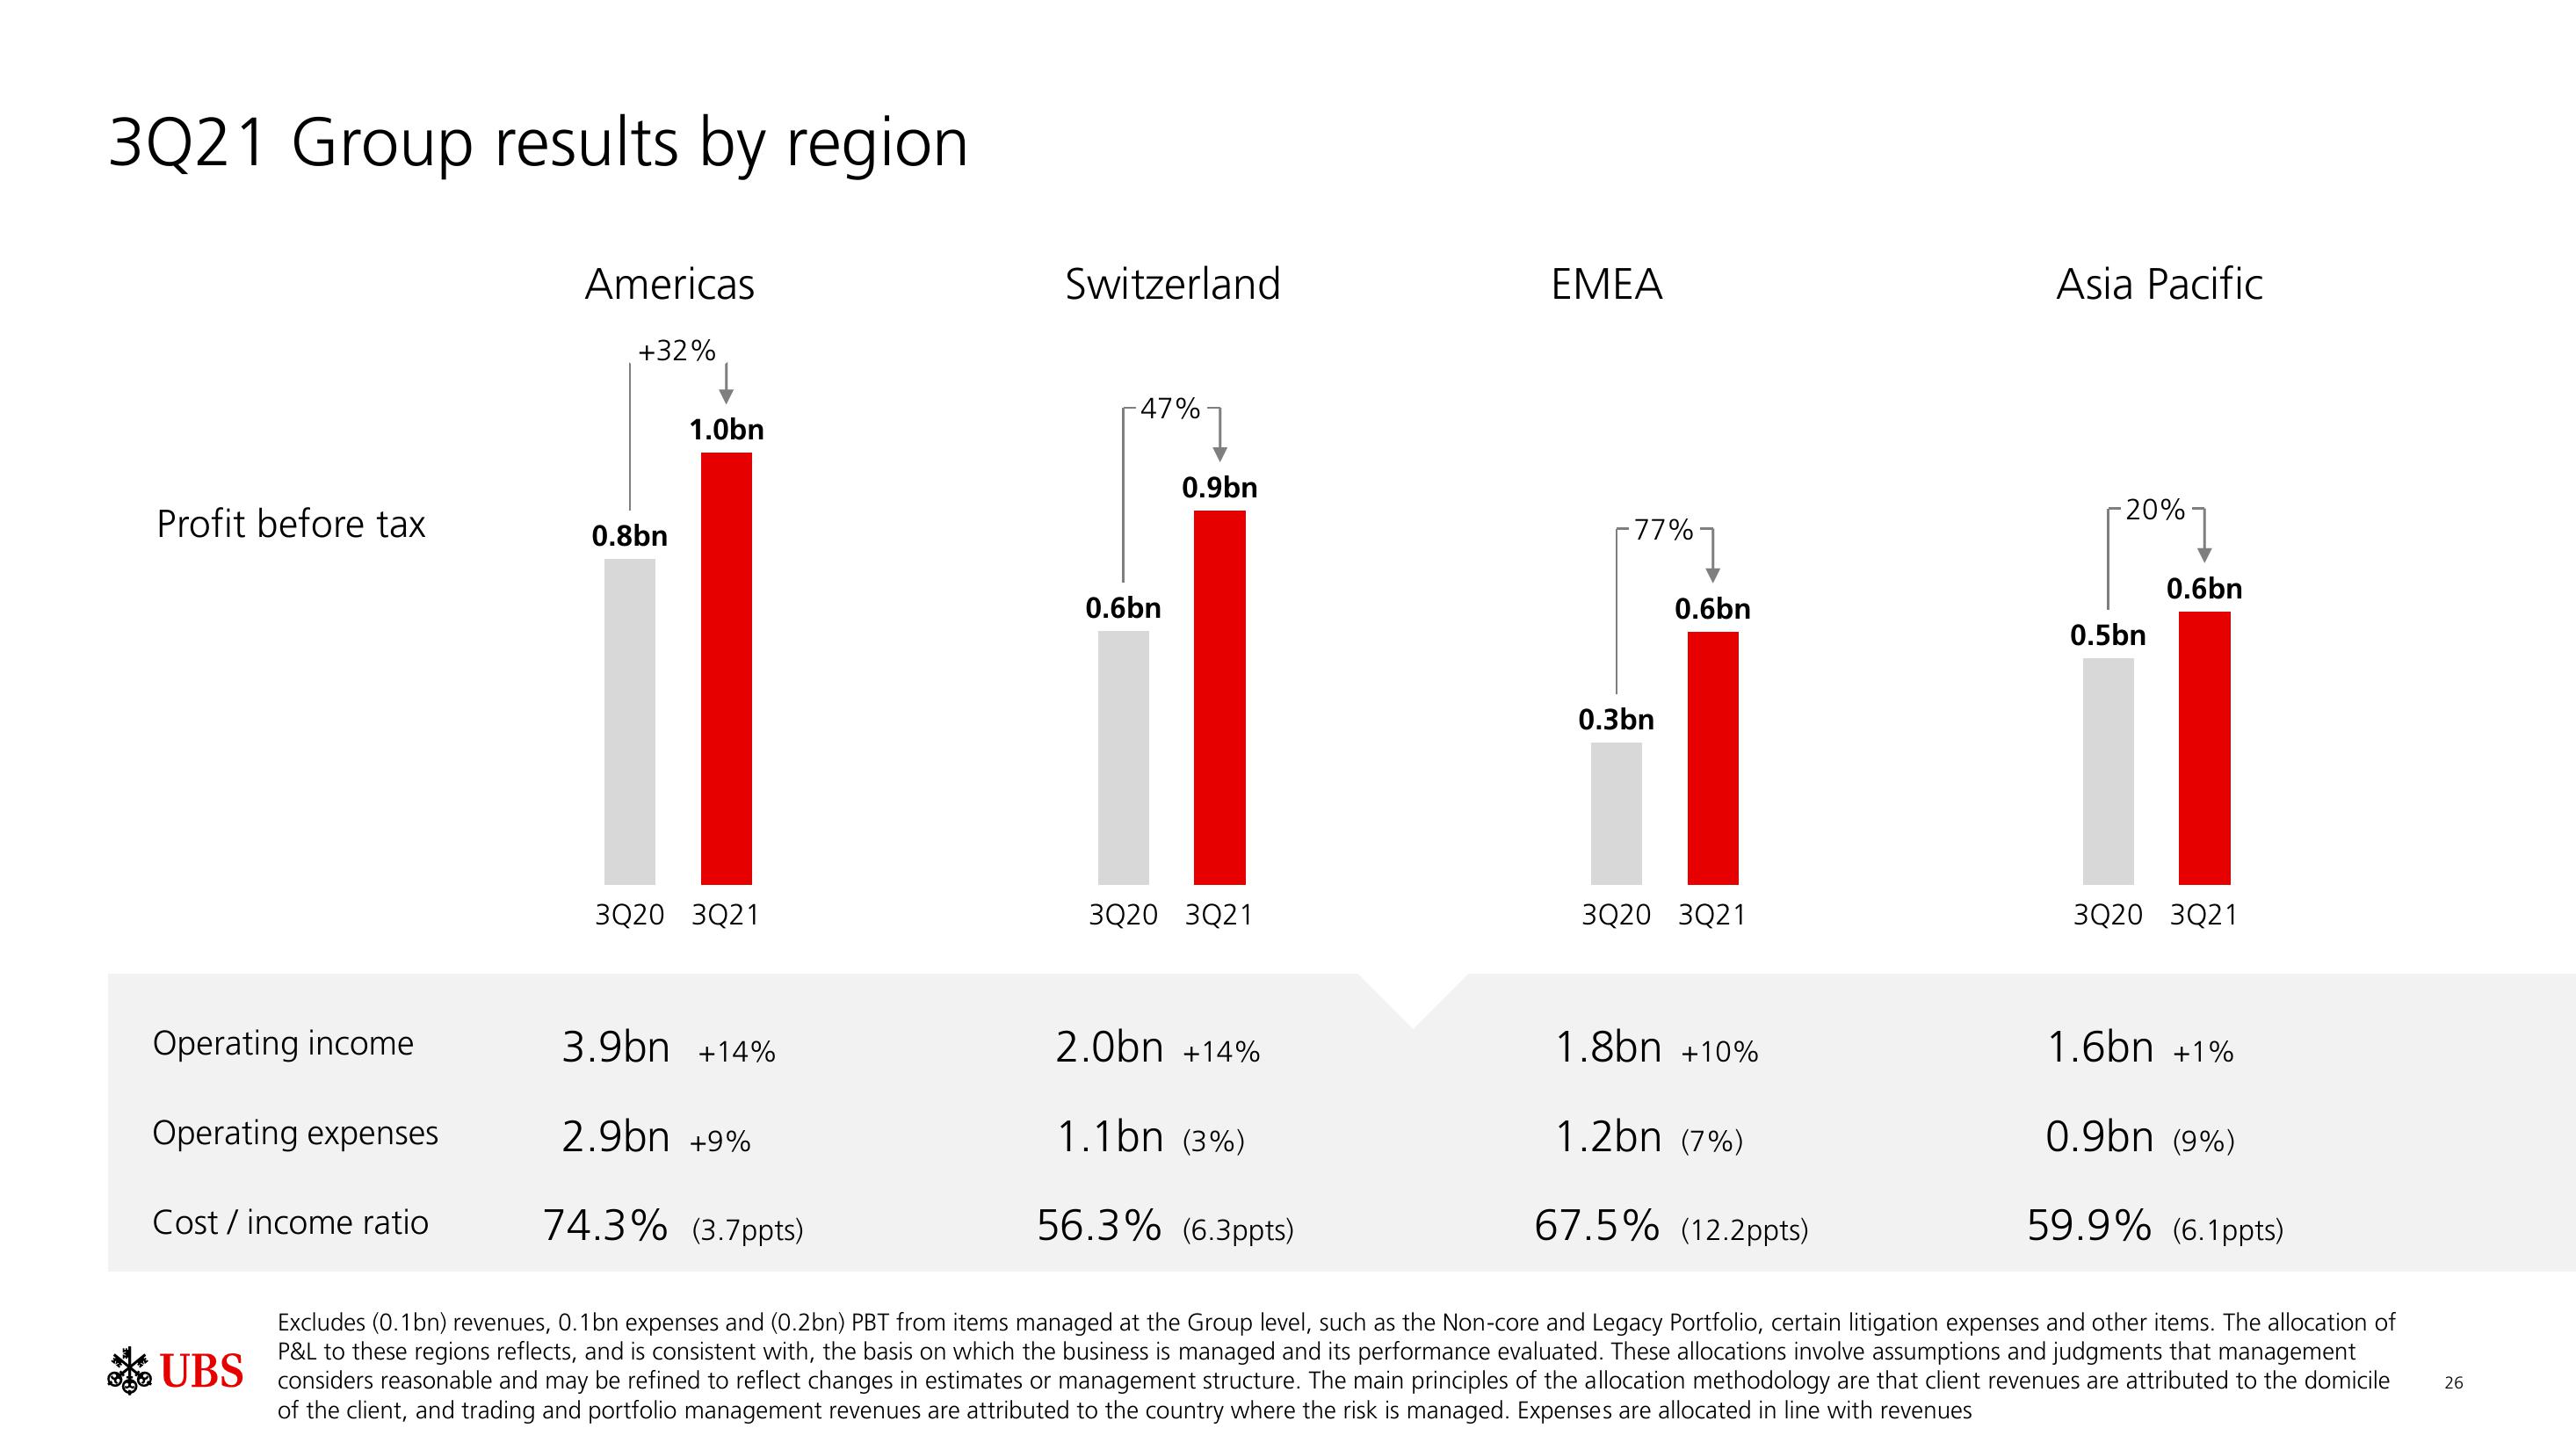
3Q21 Group results by region
Profit before tax
Operating income
Operating expenses
Americas
+32%
Cost / income ratio
0.8bn
1.0bn
3Q20 3Q21
Switzerland
3.9bn +14%
-47%
%]
0.9bn
0.6bn
3Q20 3Q21
EMEA
-77%
0.3bn
Į
0.6bn
3Q20 3Q21
Asia Pacific
2.0bn +14%
2.9bn +9%
1.1bn (3%)
74.3% (3.7ppts)
56.3% (6.3ppts)
Excludes (0.1bn) revenues, 0.1bn expenses and (0.2bn) PBT from items managed at the Group level, such as the Non-core and Legacy Portfolio, certain litigation expenses and other items. The allocation of
P&L to these regions reflects, and is consistent with, the basis on which the business is managed and its performance evaluated. These allocations involve assumptions and judgments that management
UBS considers reasonable and may be refined to reflect changes in estimates or management structure. The main principles of the allocation methodology are that client revenues are attributed to the domicile
of the client, and trading and portfolio management revenues are attributed to the country where the risk is managed. Expenses are allocated in line with revenues
1.8bn +10%
1.2bn (7%)
67.5% (12.2 ppts)
-20%
0.5bn
1
0.6bn
3Q20 3021
1.6bn +1%
0.9bn (9%)
59.9% (6.1ppts)
26View entire presentation