Vivid Seats SPAC Presentation Deck
2. Industry
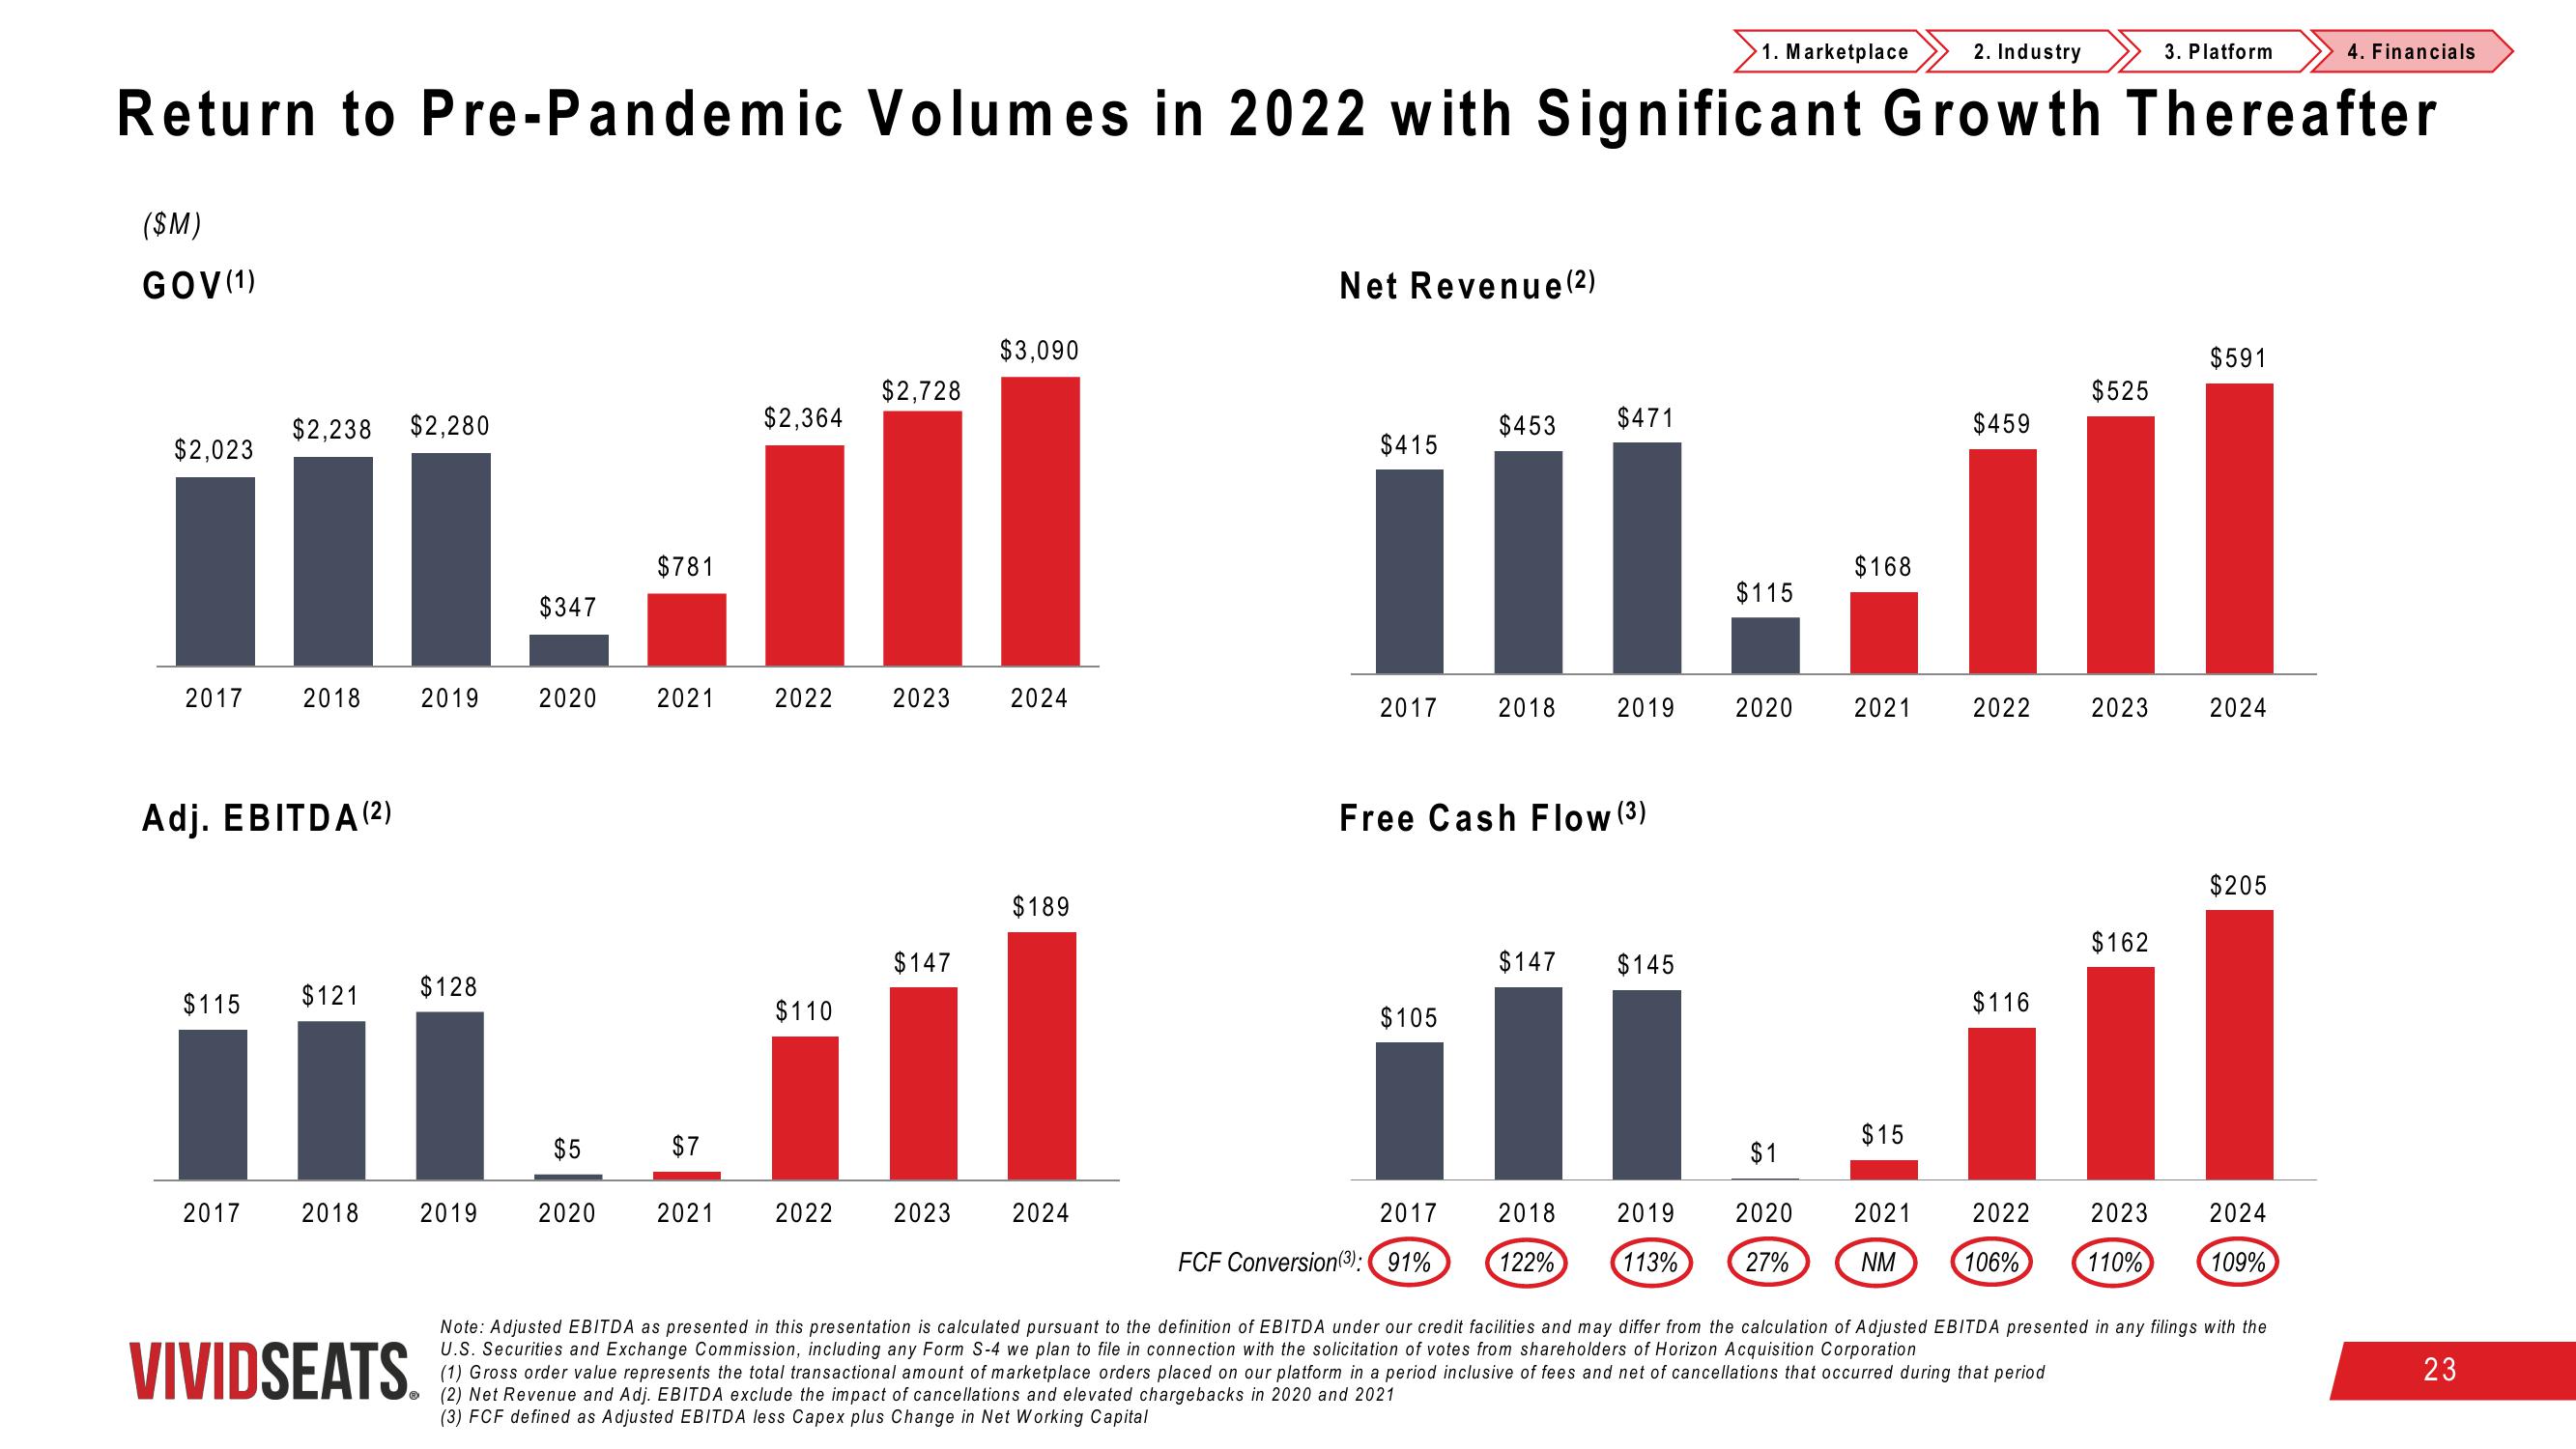
Return to Pre-Pandemic Volumes in 2022 with Significant Growth Thereafter
($M)
GOV (1)
$2,023
$2,238 $2,280
2017 2018 2019
Adj. EBITDA (²)
$115 $121
2017
2018
VIVIDSEATS.
$128
2019
$347
2020
$781
$2,364
2021 2022
$110
$5
$7
2020 2021 2022
$2,728
2023
$147
2023
$3,090
2024
$189
2024
Net Revenue (²)
$415
2017
$453 $471
M..ill
$168
$115
$105
Free Cash Flow (³)
2017
FCF Conversion (3): (91%
2018
(2) Net Revenue and Adj. EBITDA exclude the impact of cancellations and elevated chargebacks in 2020 and 2021
(3) FCF defined as Adjusted EBITDA less Capex plus Change in Net Working Capital
2019
$147 $145
2018
122%
1. Marketplace
2019
113%
2020
$1
2020
27%
2021
$15
2021
NM
$459
2022
$116
2022
$525
106%
2023
$162
3. Platform
2023
110%
$591
2024
$205
2024
109%
Note: Adjusted EBITDA as presented in this presentation is calculated pursuant to the definition of EBITDA under our credit facilities and may differ from the calculation of Adjusted EBITDA presented in any filings with the
U.S. Securities and Exchange Commission, including any Form S-4 we plan to file in connection with the solicitation of votes from shareholders of Horizon Acquisition Corporation
(1) Gross order value represents the total transactional amount of marketplace orders placed on our platform in a period inclusive of fees and net of cancellations that occurred during that period
4. Financials
23View entire presentation