Trian Partners Activist Presentation Deck
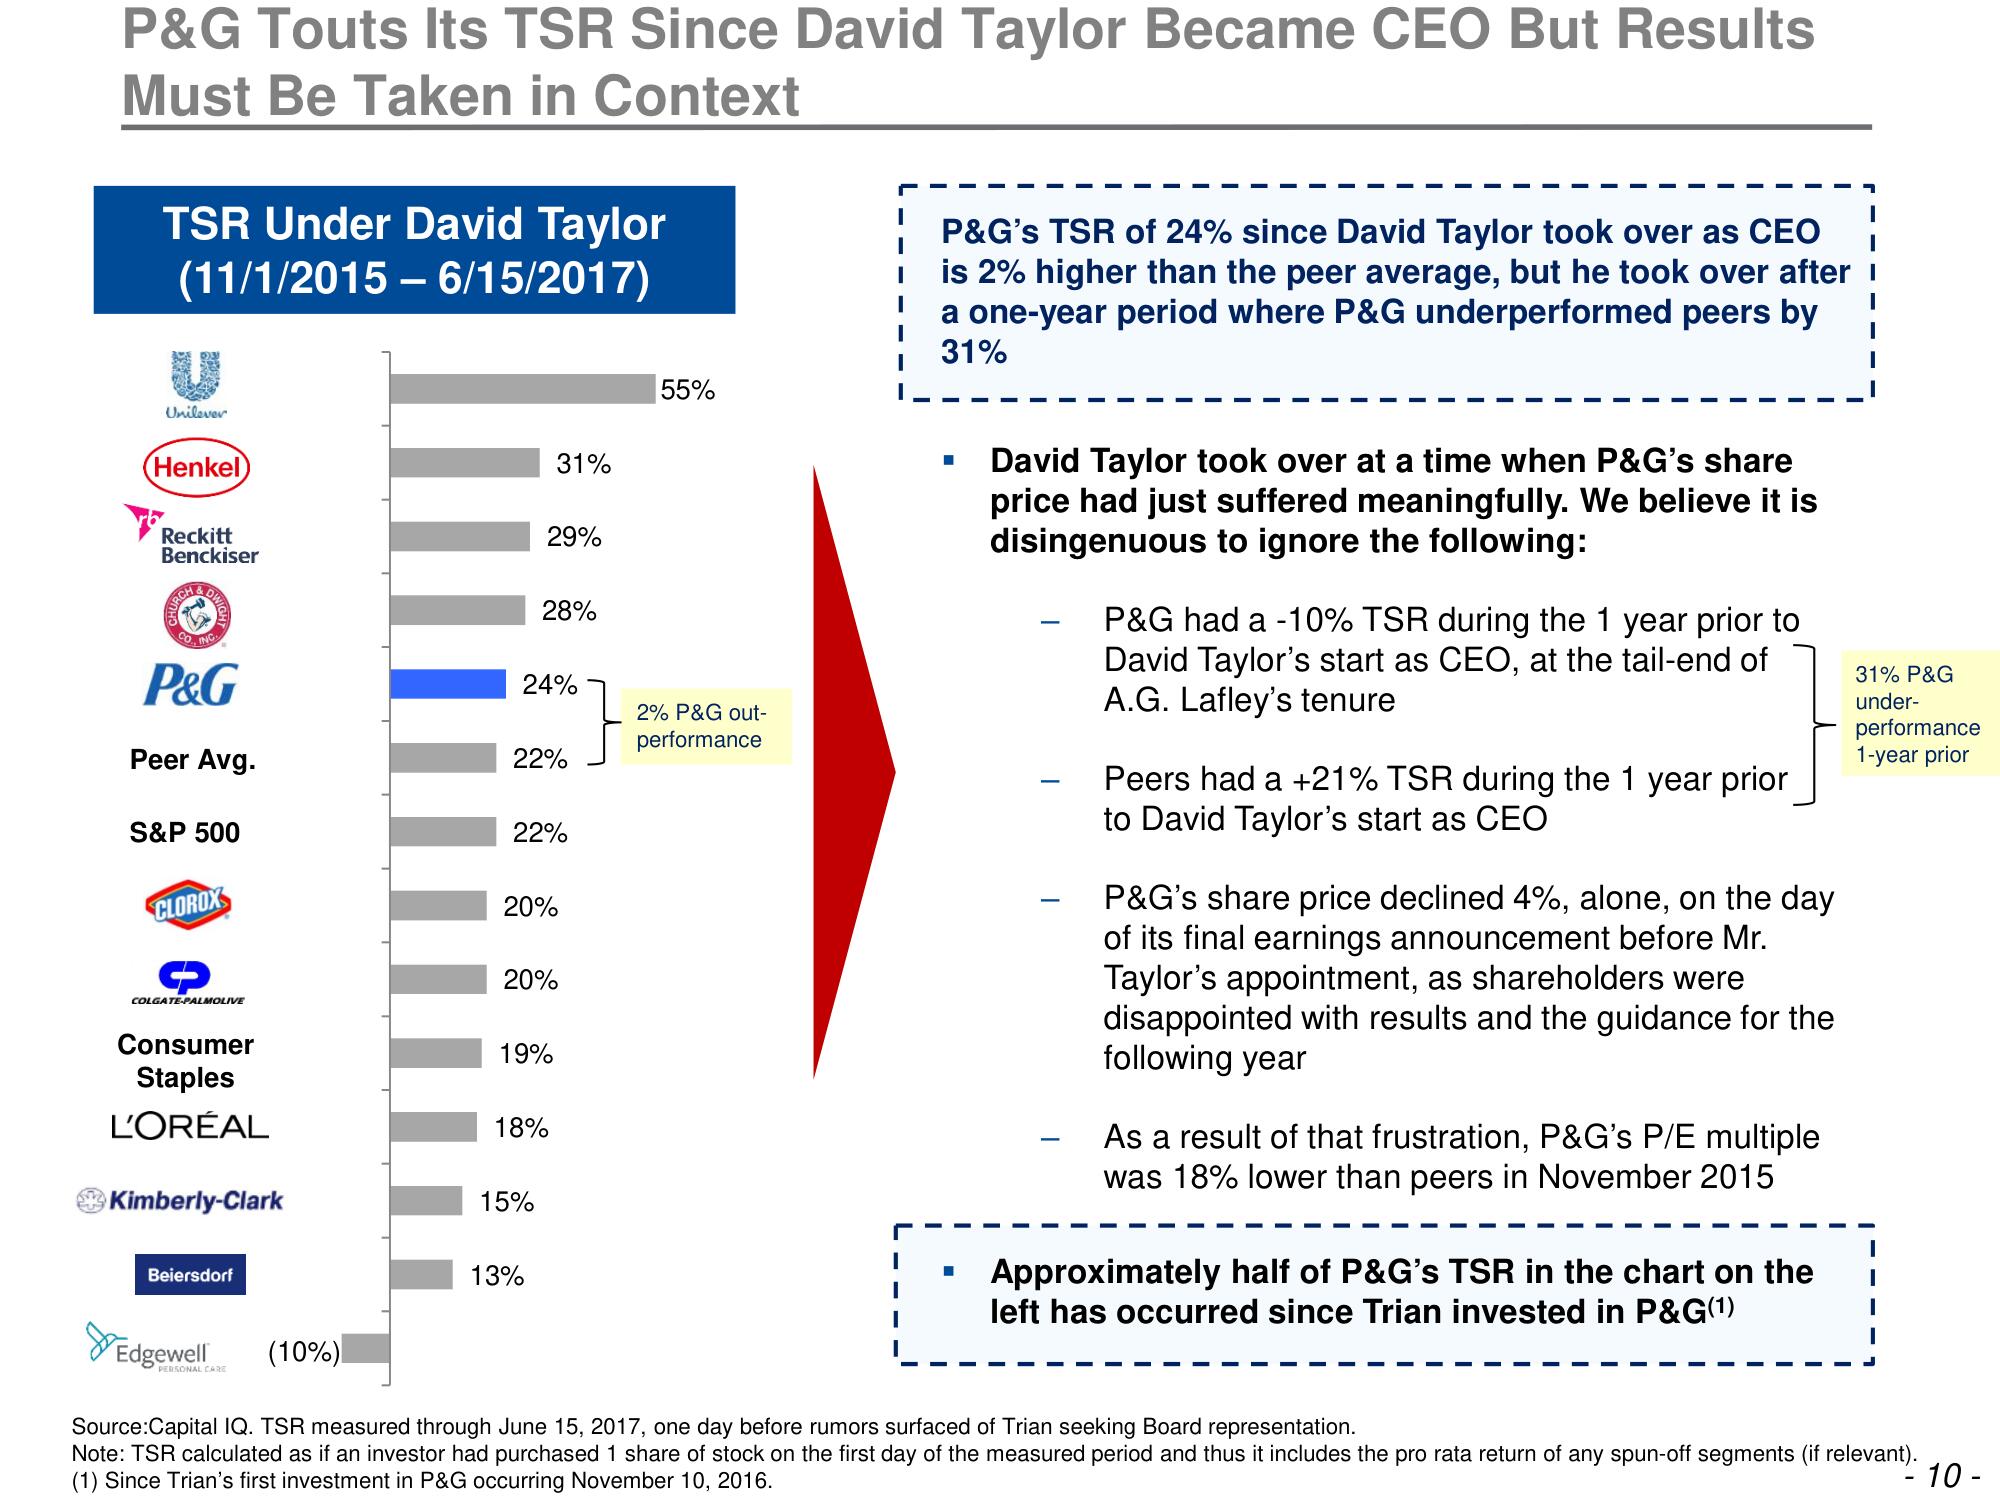
P&G Touts Its TSR Since David Taylor Became CEO But Results
Must Be Taken in Context
TSR Under David Taylor
(11/1/2015 - 6/15/2017)
Unilever
Henkel
Reckitt
Benckiser
P&G
Peer Avg.
S&P 500
CLOROX
→
COLGATE-PALMOLIVE
Consumer
Staples
L'ORÉAL
Kimberly-Clark
Beiersdorf
Edgewell
PERSONAL CARE
(10%)
24%
31%
29%
28%
22%
22%
20%
20%
19%
18%
15%
13%
55%
2% P&G out-
performance
P&G's TSR of 24% since David Taylor took over as CEO
is 2% higher than the peer average, but he took over after
a one-year period where P&G underperformed peers by
31%
David Taylor took over at a time when P&G's share
price had just suffered meaningfully. We believe it is
disingenuous to ignore the following:
P&G had a -10% TSR during the 1 year prior to
David Taylor's start as CEO, at the tail-end of
A.G. Lafley's tenure
Peers had a +21% TSR during the 1 year prior
to David Taylor's start as CEO
P&G's share price declined 4%, alone, on the day
of its final earnings announcement before Mr.
Taylor's appointment, as shareholders were
disappointed with results and the guidance for the
following year
As a result of that frustration, P&G's P/E multiple
was 18% lower than peers in November 2015
Approximately half of P&G's TSR in the chart on the
left has occurred since Trian invested in P&G(1)
31% P&G
under-
performance
1-year prior
Source:Capital IQ. TSR measured through June 15, 2017, one day before rumors surfaced of Trian seeking Board representation.
Note: TSR calculated as if an investor had purchased 1 share of stock on the first day of the measured period and thus it includes the pro rata return of any spun-off segments (if relevant).
(1) Since Trian's first investment in P&G occurring November 10, 2016.
10-View entire presentation