Confluent Investor Presentation Deck
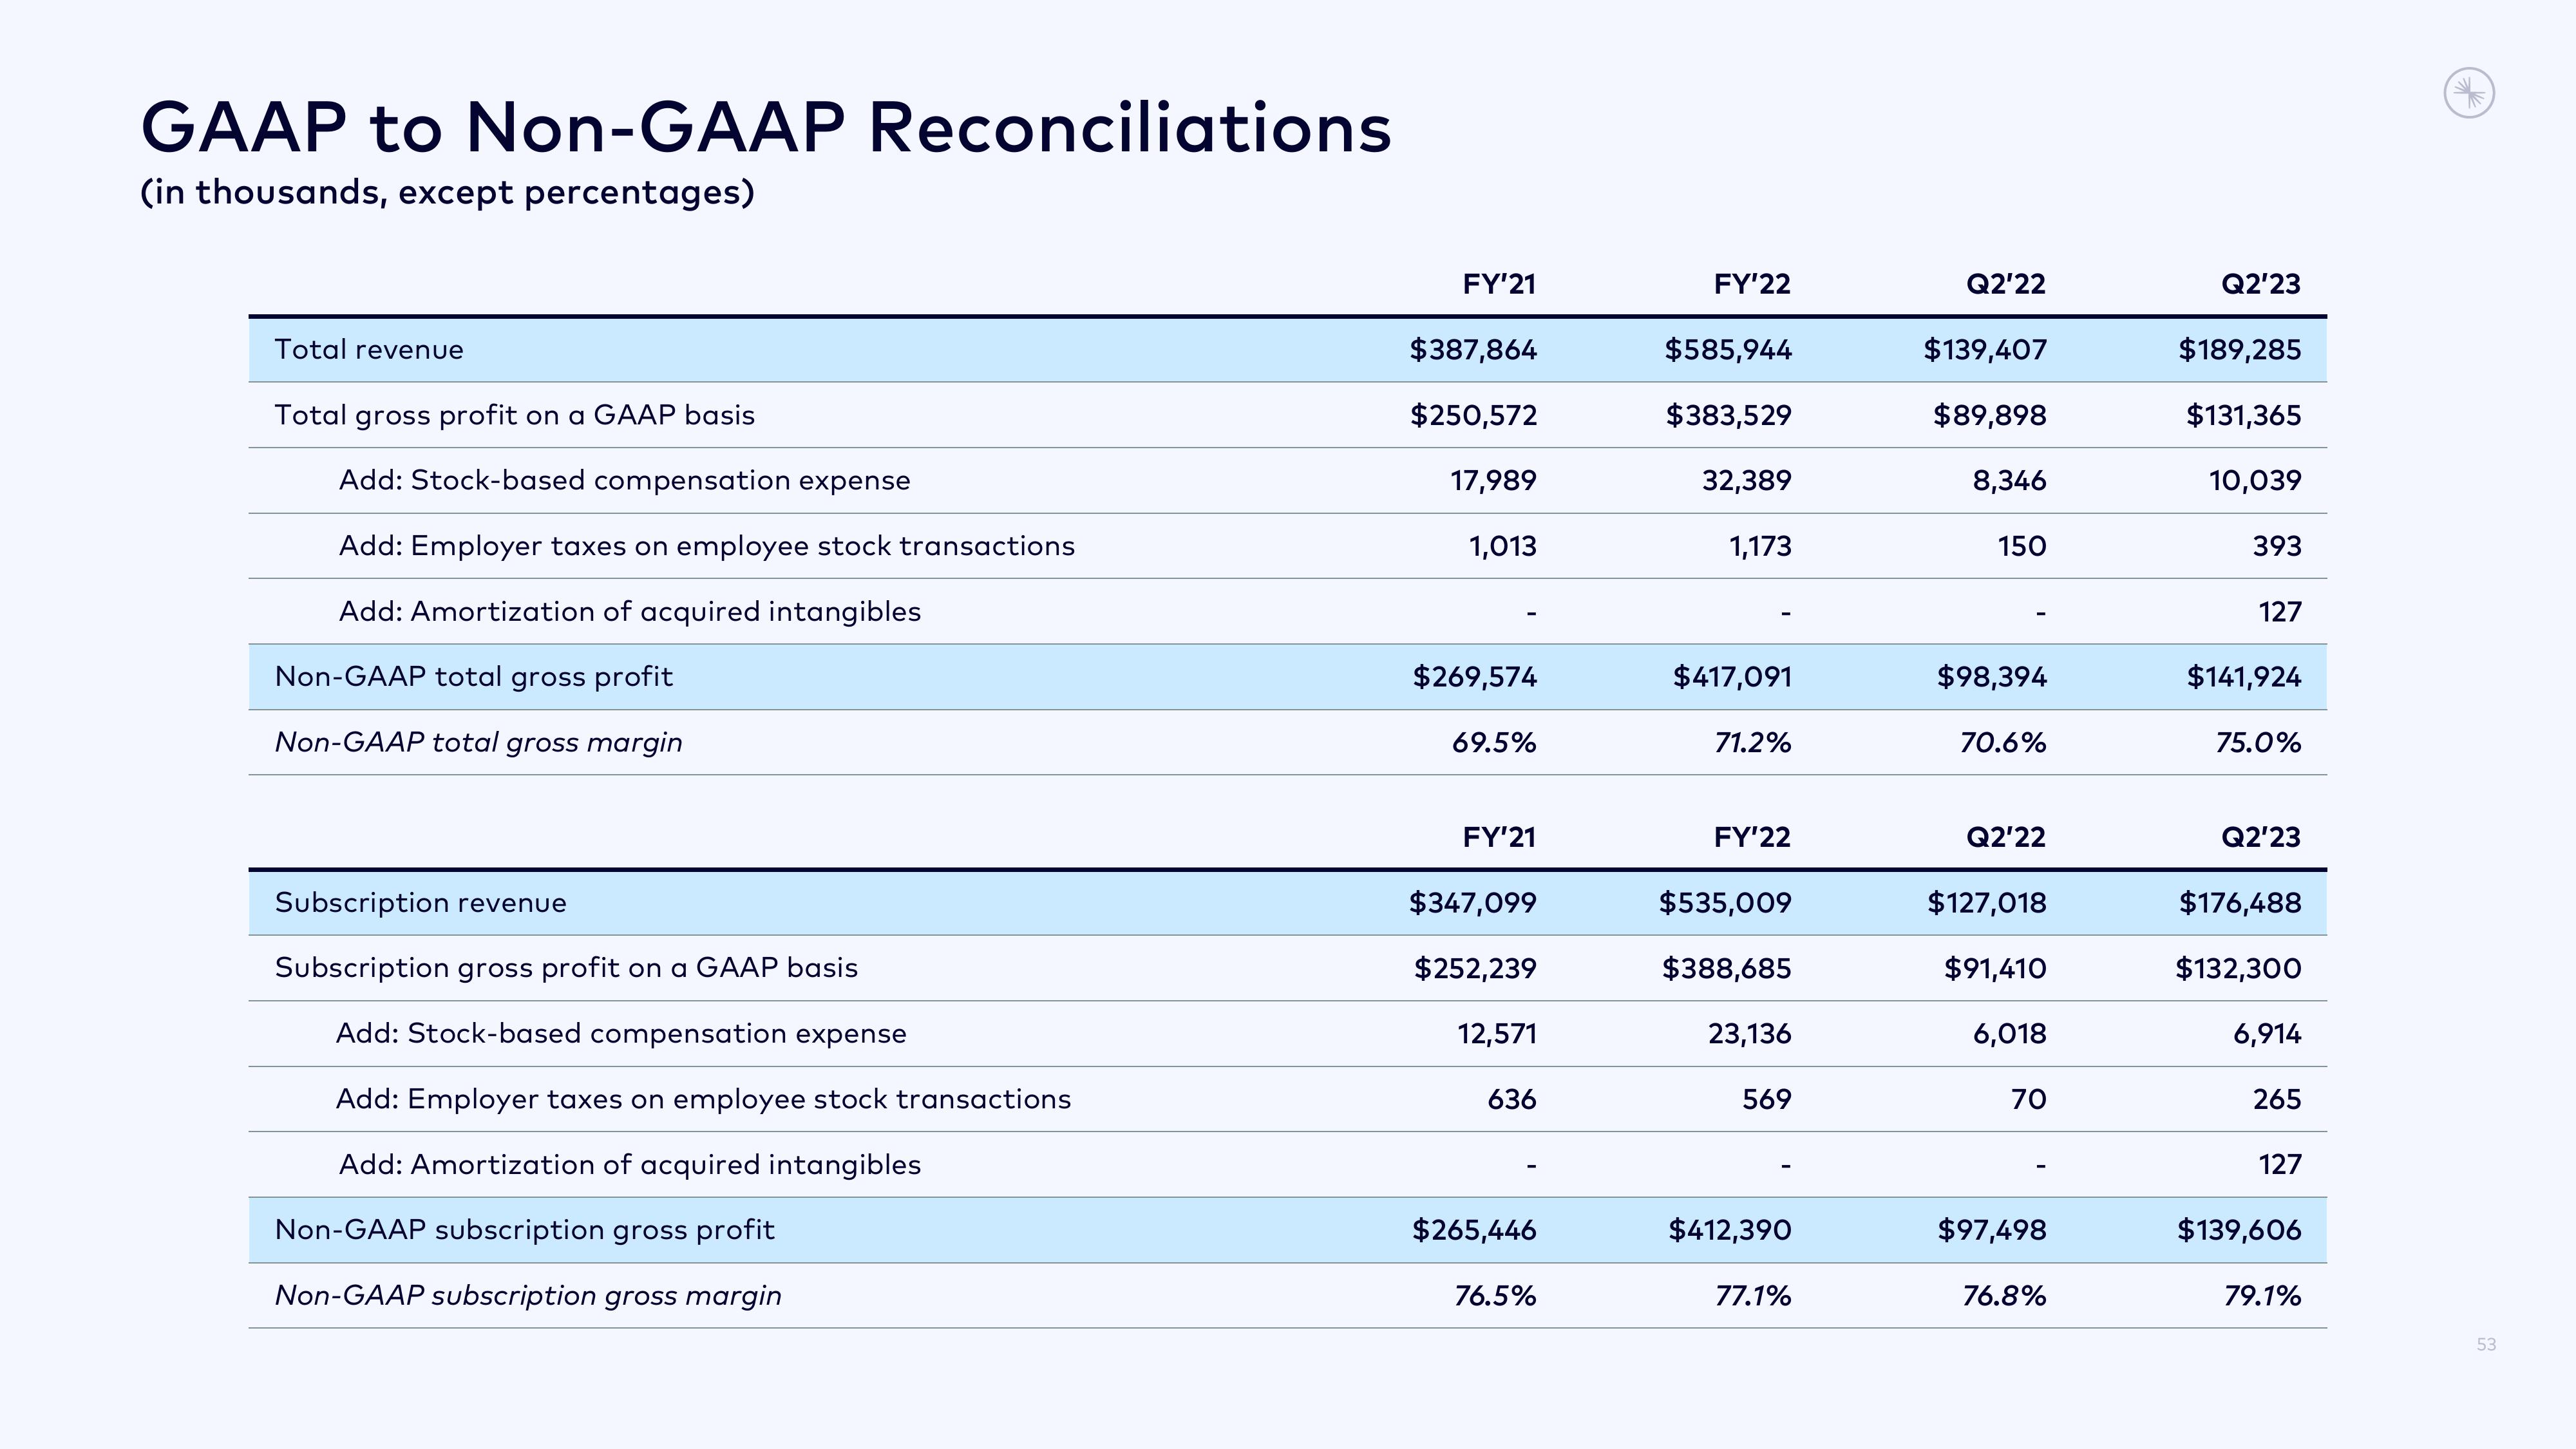
GAAP to Non-GAAP Reconciliations
(in thousands, except percentages)
Total revenue
Total gross profit on a GAAP basis
Add: Stock-based compensation expense
Add: Employer taxes on employee stock transactions
Add: Amortization of acquired intangibles
Non-GAAP total gross profit
Non-GAAP total gross margin
Subscription revenue
Subscription gross profit on a GAAP basis
Add: Stock-based compensation expense
Add: Employer taxes on employee stock transactions
Add: Amortization of acquired intangibles
Non-GAAP subscription gross profit
Non-GAAP subscription gross margin
FY'21
$387,864
$250,572
17,989
1,013
$269,574
69.5%
FY'21
$347,099
$252,239
12,571
636
$265,446
76.5%
FY'22
$585,944
$383,529
32,389
1,173
$417,091
71.2%
FY'22
$535,009
$388,685
23,136
569
$412,390
77.1%
Q2'22
$139,407
$89,898
8,346
150
$98,394
70.6%
Q2'22
$127,018
$91,410
6,018
70
$97,498
76.8%
Q2'23
$189,285
$131,365
10,039
393
127
$141,924
75.0%
Q2'23
$176,488
$132,300
6,914
265
127
$139,606
79.1%
53View entire presentation