Amplitude Results Presentation Deck
(8
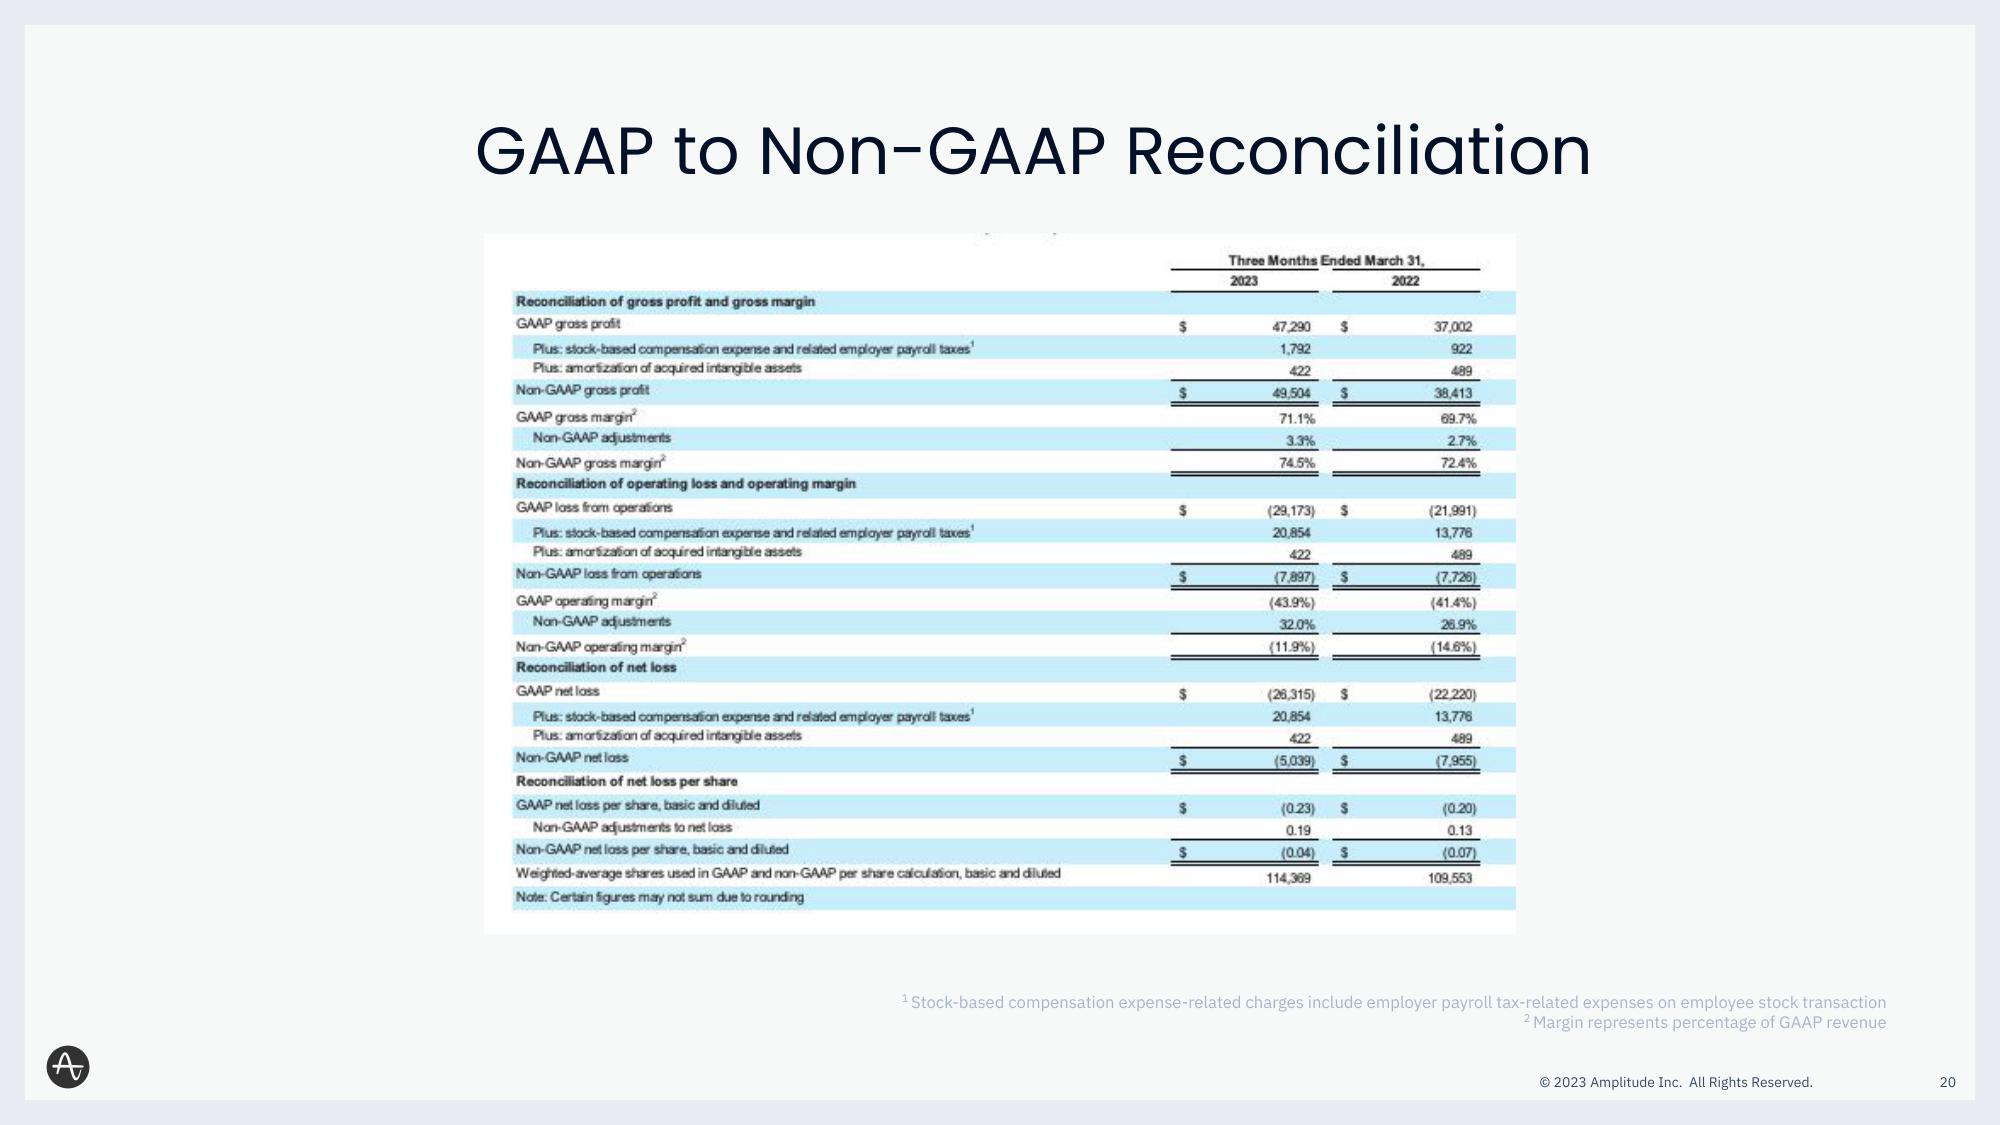
GAAP to Non-GAAP Reconciliation
Reconciliation of gross profit and gross margin
GAAP gross profit
Plus: stock-based compensation expense and related employer payroll taxes
Plus: amortization of acquired intangible assets
Non-GAAP gross profit
GAAP gross margin
Non-GAAP adjustments
Nan-GAAP gross margin
Reconciliation of operating loss and operating margin
GAAP loss from operations
Plus: stock-based compensation expense and related employer payroll taxes
Plus: amortization of acquired intangible assets
Non-GAAP loss from operations
GAAP operating margin
Non-GAAP adjustments
Non-GAAP operating margin
Reconciliation of net loss
GAAP net loss
Plus: stock-based compensation expense and related employer payroll taxes
Plus: amortization of acquired intangible assets
Non-GAAP net loss
Reconciliation of net loss per share
GAAP net loss per share, basic and diluted
Non-GAAP adjustments to net loss
Non-GAAP net loss per share, basic and diluted
Weighted average shares used in GAAP and non-GAAP per share calculation, basic and diluted
Note: Certain figures may not sum due to rounding
$
$
$
$
$
Three Months Ended March 31,
2023
2022
47,290 $
1.792
422
49,504 $
71.1%
3.3%
74.5%
(29,173)
20,854
422
(7,897)
(43.9%)
32.0%
(11.9%)
(26,315)
20,854
422
(5,039)
$
37,002
922
489
38,413
(0.23) $
0.19
(0.04)
114,369
69.7%
2.7%
72.4%
(21,991)
13,776
1111
489
(7,726)
(41.4%)
26.9%
(14.6%)
(22,220)
13,776
489
(7,955)
(0.20)
0.13
(0.07)
109,553
¹Stock-based compensation expense-related charges include employer payroll tax-related expenses on employee stock transaction
2 Margin represents percentage of GAAP revenue
© 2023 Amplitude Inc. All Rights Reserved.
20View entire presentation