BAT Results Presentation Deck
1
2
Q-0
GEOP
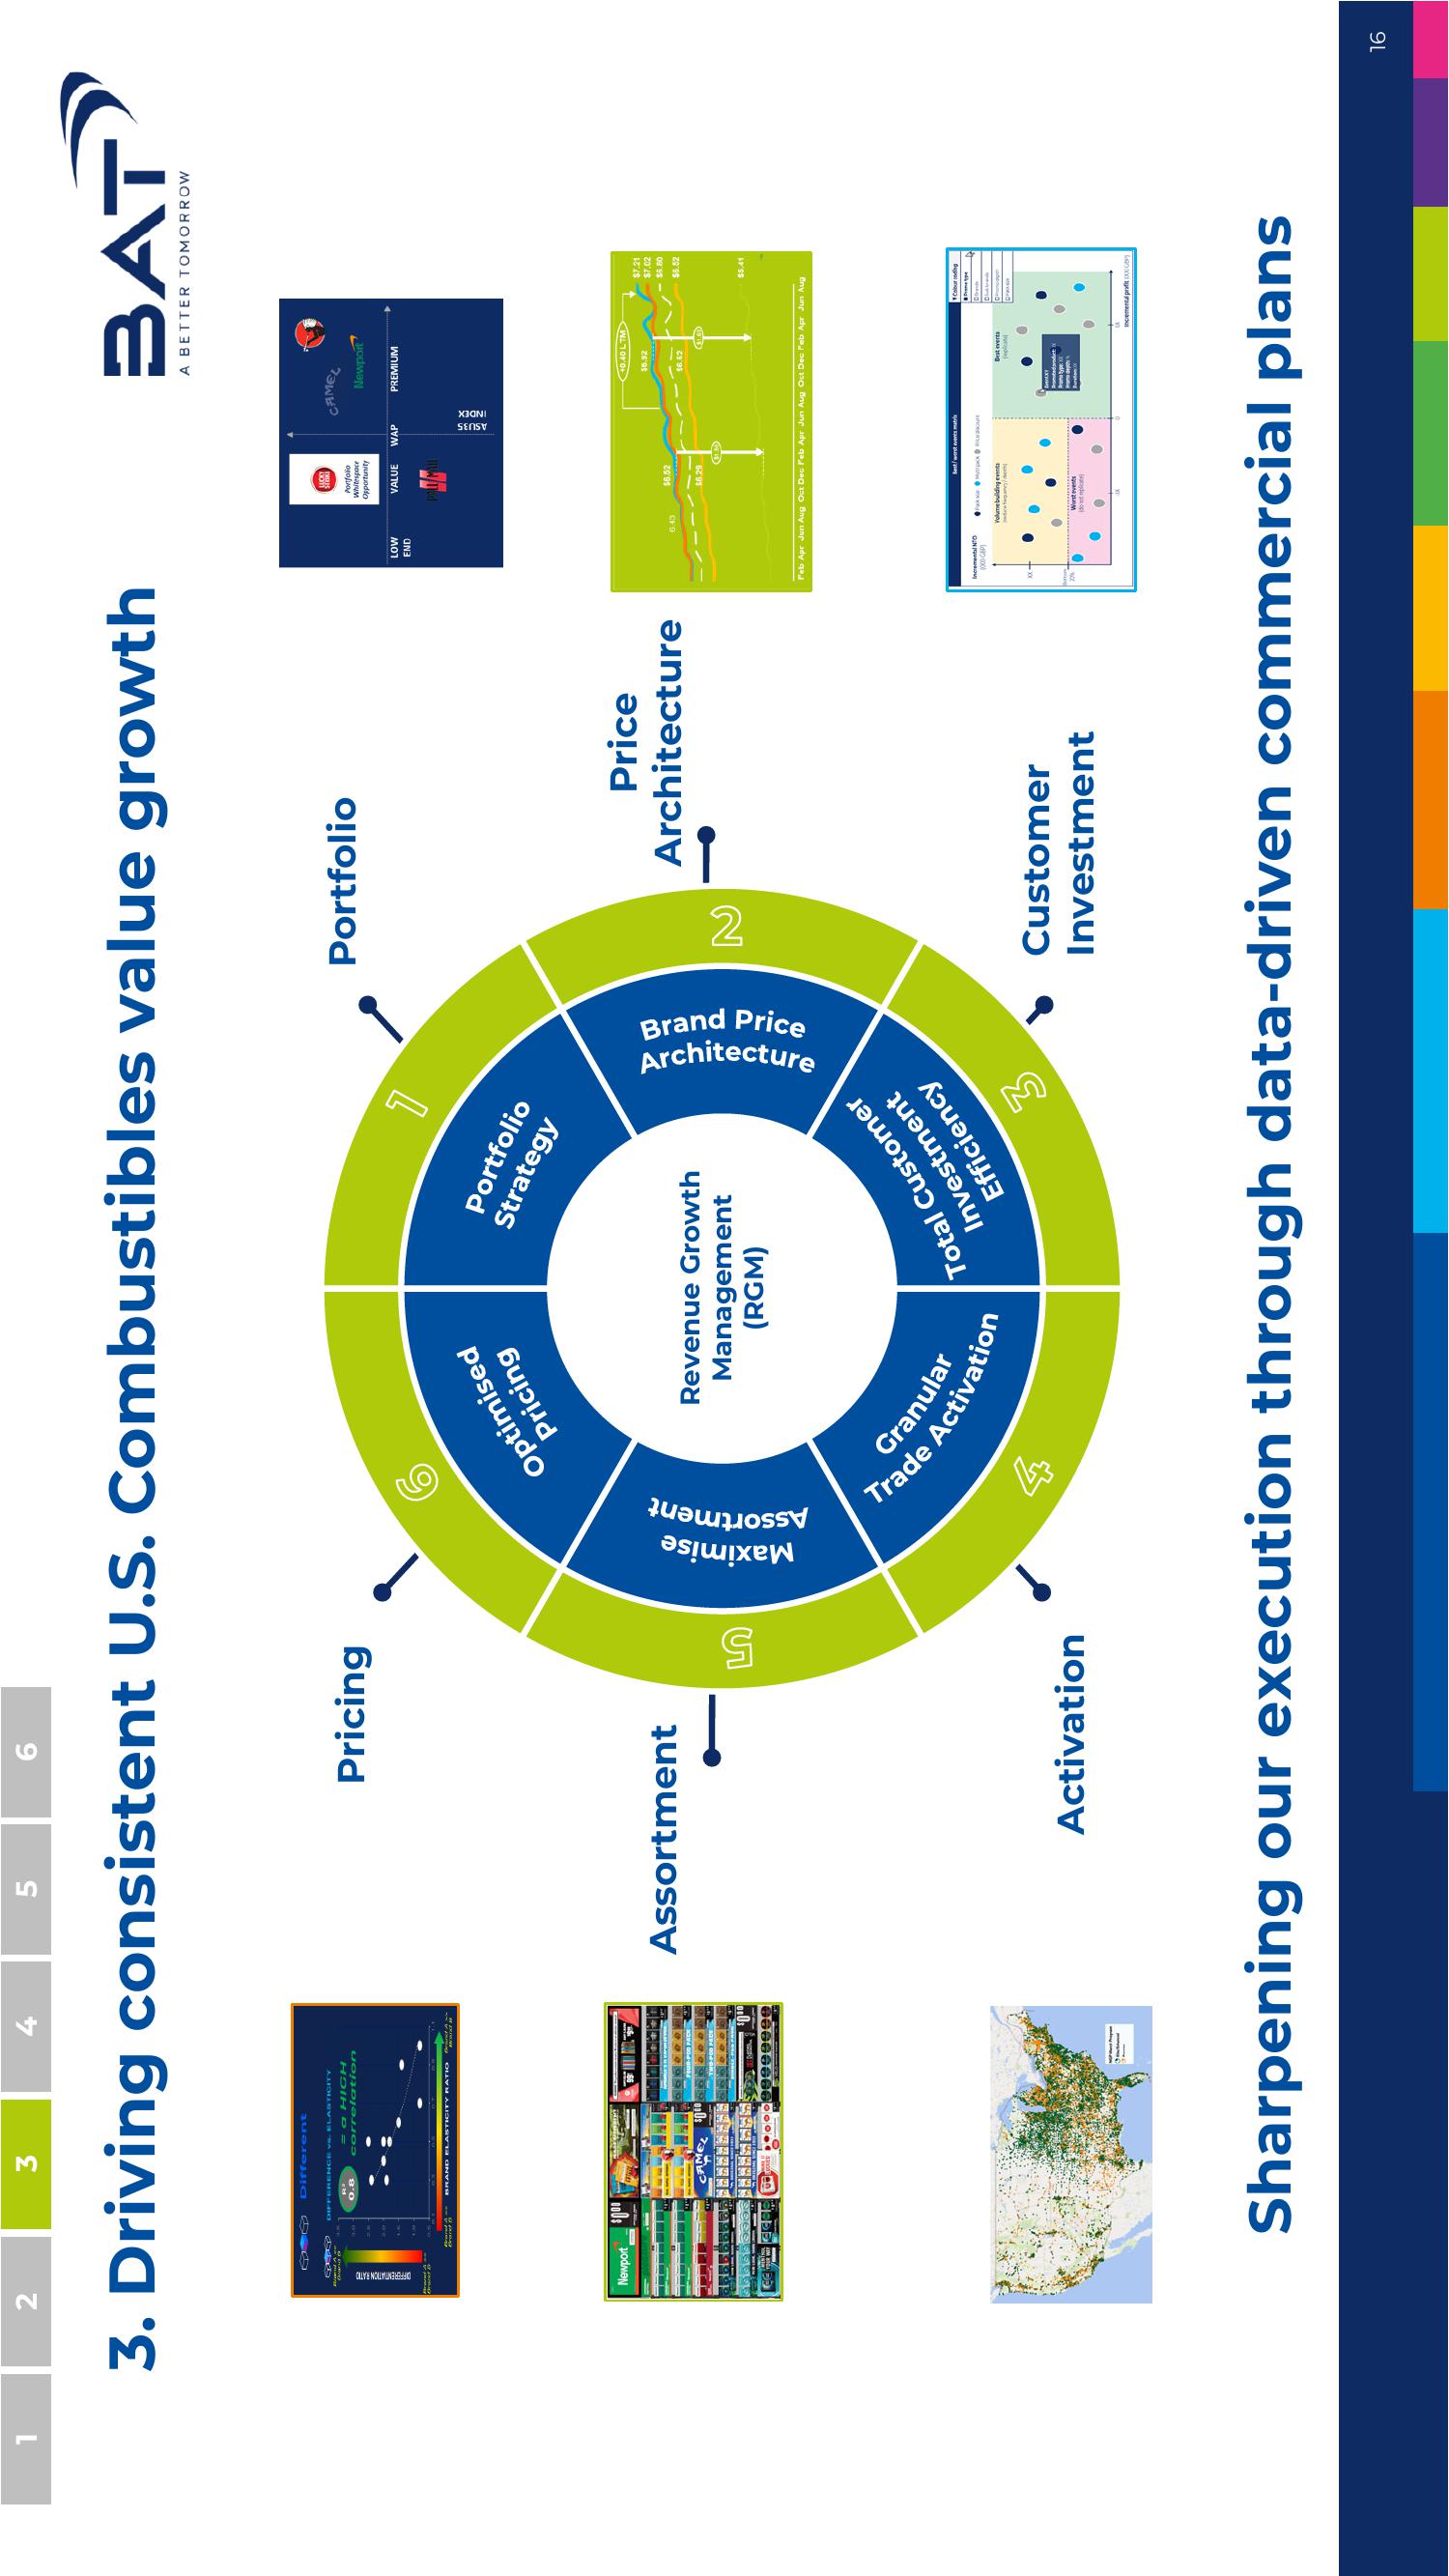
3. Driving consistent U.S. Combustibles value growth
DIFFERENTIATION RATIO
Newport
3
var
Different
DIFFERENCE vs ELASTICITY
a HIGH
correlation
BRAND ELASTICITY RATIO
3
Brandt H
****
POL
5
eeee
6
Pricing
Assortment
Activation
Optimised
Pricing
Maximise
Assortment
Trade
Granular
Revenue Growth
Management
(RGM)
4
Portfolio
Strategy
Activation
Total Customer
Investment
Efficiency
3
Portfolio
Architectu
Brand Price
ecture
2
Price
Architecture
Customer
Investment
LOW
END
6:43
Incremental NO
1000 GBP
S
Portfolio
Whitespace
Opportunity
VALUE WAP
$6.52
$6.29
$1.50
Volume building event
dice fequancy
wordt events
do
Best/worst events matri
Faks Mutxesour
ASU35
INDEX
e
BAT
A BETTER TOMORROW
CAMEL
Newport
Feb Apr Jun Aug Oct Dec Feb Apr Jun Aug Oct Dec Feb Apr Jun Aug
PREMIUM
+0.40 LTM>
$6.92
1
$7.21
$7.02
$5.80
$6.52
Dest events
1400
Colour coding
Incremental profit 000 GBP
Sharpening our execution through data-driven commercial plans
16View entire presentation