Altus Power SPAC Presentation Deck
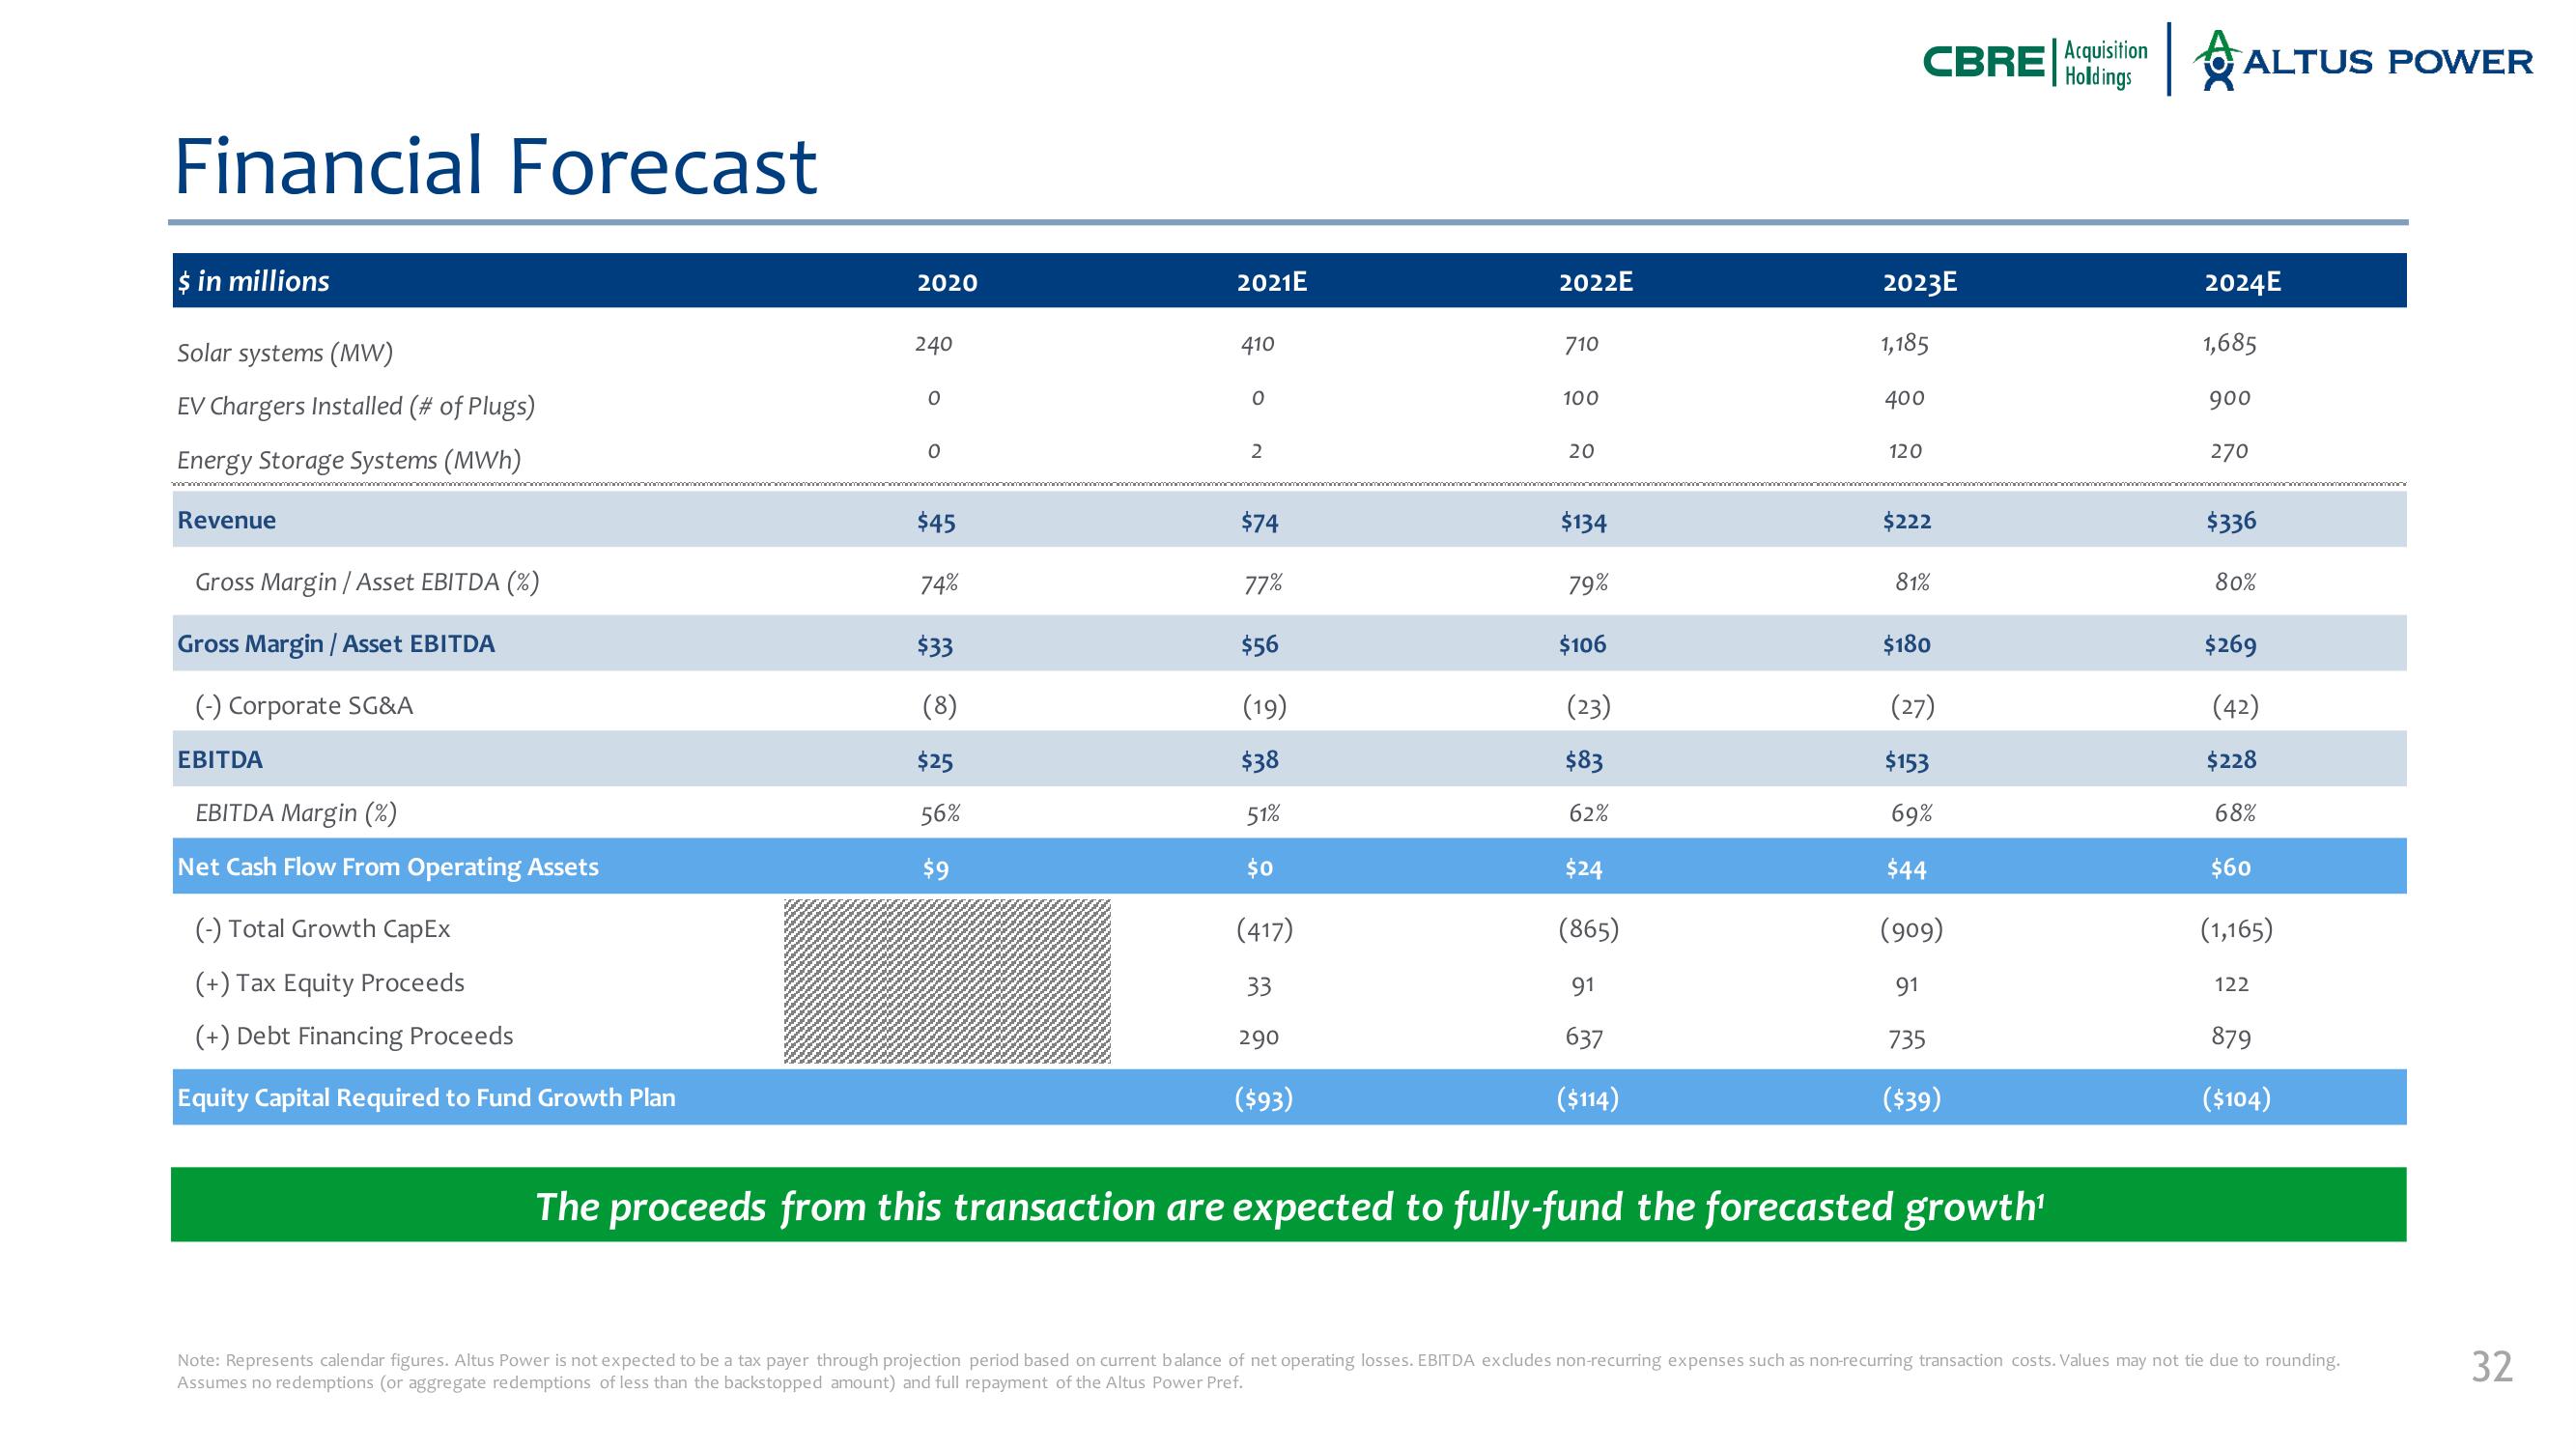
Financial Forecast
$ in millions
Solar systems (MW)
EV Chargers Installed (# of Plugs)
Energy Storage Systems (MWh)
Revenue
Gross Margin / Asset EBITDA (%)
Gross Margin / Asset EBITDA
(-) Corporate SG&A
EBITDA
EBITDA Margin (%)
Net Cash Flow From Operating Assets
(-) Total Growth CapEx
(+) Tax Equity Proceeds
(+) Debt Financing Proceeds
Equity Capital Required to Fund Growth Plan
2020
240
0
$45
74%
$33
(8)
$25
56%
$9
2021E
410
0
2
$74
77%
$56
(19)
$38
51%
$0
(417)
33
290
($93)
2022E
710
100
20
$134
79%
$106
(23)
$83
62%
$24
(865)
91
637
($114)
CBRE
2023E
1,185
400
120
$222
81%
$180
(27)
$153
69%
$44
(909)
91
735
($39)
The proceeds from this transaction are expected to fully-fund the forecasted growth¹
Acquisition
Holdings
ALTUS POWER
2024E
1,685
900
270
$336
80%
$269
(42)
$228
68%
$60
(1,165)
122
879
($104)
Note: Represents calendar figures. Altus Power is not expected to be a tax payer through projection period based on current balance of net operating losses. EBITDA excludes non-recurring expenses such as non-recurring transaction costs. Values may not tie due to rounding.
Assumes no redemptions (or aggregate redemptions of less than the backstopped amount) and full repayment of the Altus Power Pref.
32View entire presentation