Brivo SPAC Presentation Deck
Summary P&L
($ in millions)
Cumulative Future Revenue Value (FRV) (¹)
Subscription Revenue
Hardware & Other Revenue
Total Revenue
YOY Growth (%)
Gross Profit
% Margin
Adjusted EBITDA
% Margin
FCF(3)
Brivo financial summary and expected forecasts
(2)
Adjusted EBITDA Reconciliation
($ in millions)
Net Income (Loss)
Income Tax
Interest Expense
Depreciation & Amoritization
Stock Based Compensation
Adjusted EBITDA (2)
Obrivo
Free Cash Flow Reconciliation
($ in millions)
CF From Operations
CF From Investing
FCF(3)
2018A
2018A
2018A
$17.4
25.1
$42.5
$27.2
64.0%
$1.7
3.9%
$1.2
($3.1)
(0.3)
0.6
4.3
0.2
$1.7
2.8
(1.5)
$1.2
Actual
2019A
Actual
2019A
Actual
2019A
$21.0
30.2
$51.2
$32.6
63.7%
$4.5
8.9%
($2.8)
($1.2)
0.0
0.8
4.8
0.2
$4.5
2.1
(4.9)
($2.8)
2020A
2020A
2020A
$25.5
31.9
$57.4
12.1%
$34.2
59.5%
$8.5
14.8%
($3.1)
$1.0
0.0
1.2
5.9
0.3
$8.5
5.3
(8.4)
($3.1)
2021E
$273.5
2021E
$31.0
40.6
$71.6
2021E
24.7%
$43.6
60.9%
($15.4)
($1.6)
NM
($12.0)
0.0
0.8
9.1
0.4
($1.6)
(7.2)
(8.1)
($15.4)
2022E
$512.5
$48.6
61.5
$110.0
53.6%
2022E
$69.1
2022E
62.8%
($24.4)
($4.3)
NM
($15.7)
0.0
0.0
11.0
0.5
($4.3)
(11.6)
(12.8)
($24.4)
Projected
2023E
$989.2
$85.3
93.7
$179.1
62.8%
$106.9
59.7%
($3.5)
NM
($35.4)
Projected
2023E
($17.5)
0.0
0.0
13.5
0.5
($3.5)
Projected
2023E
(18.4)
(16.9)
($35.4)
2024E
$1,698.5
$149.8
140.1
$289.9
61.9%
$179.9
62.0%
2024E
2024E
$32.7
11.3%
$6.4
$15.7
0.0
0.0
16.5
0.5
$32.7
25.5
(19.0)
$6.4
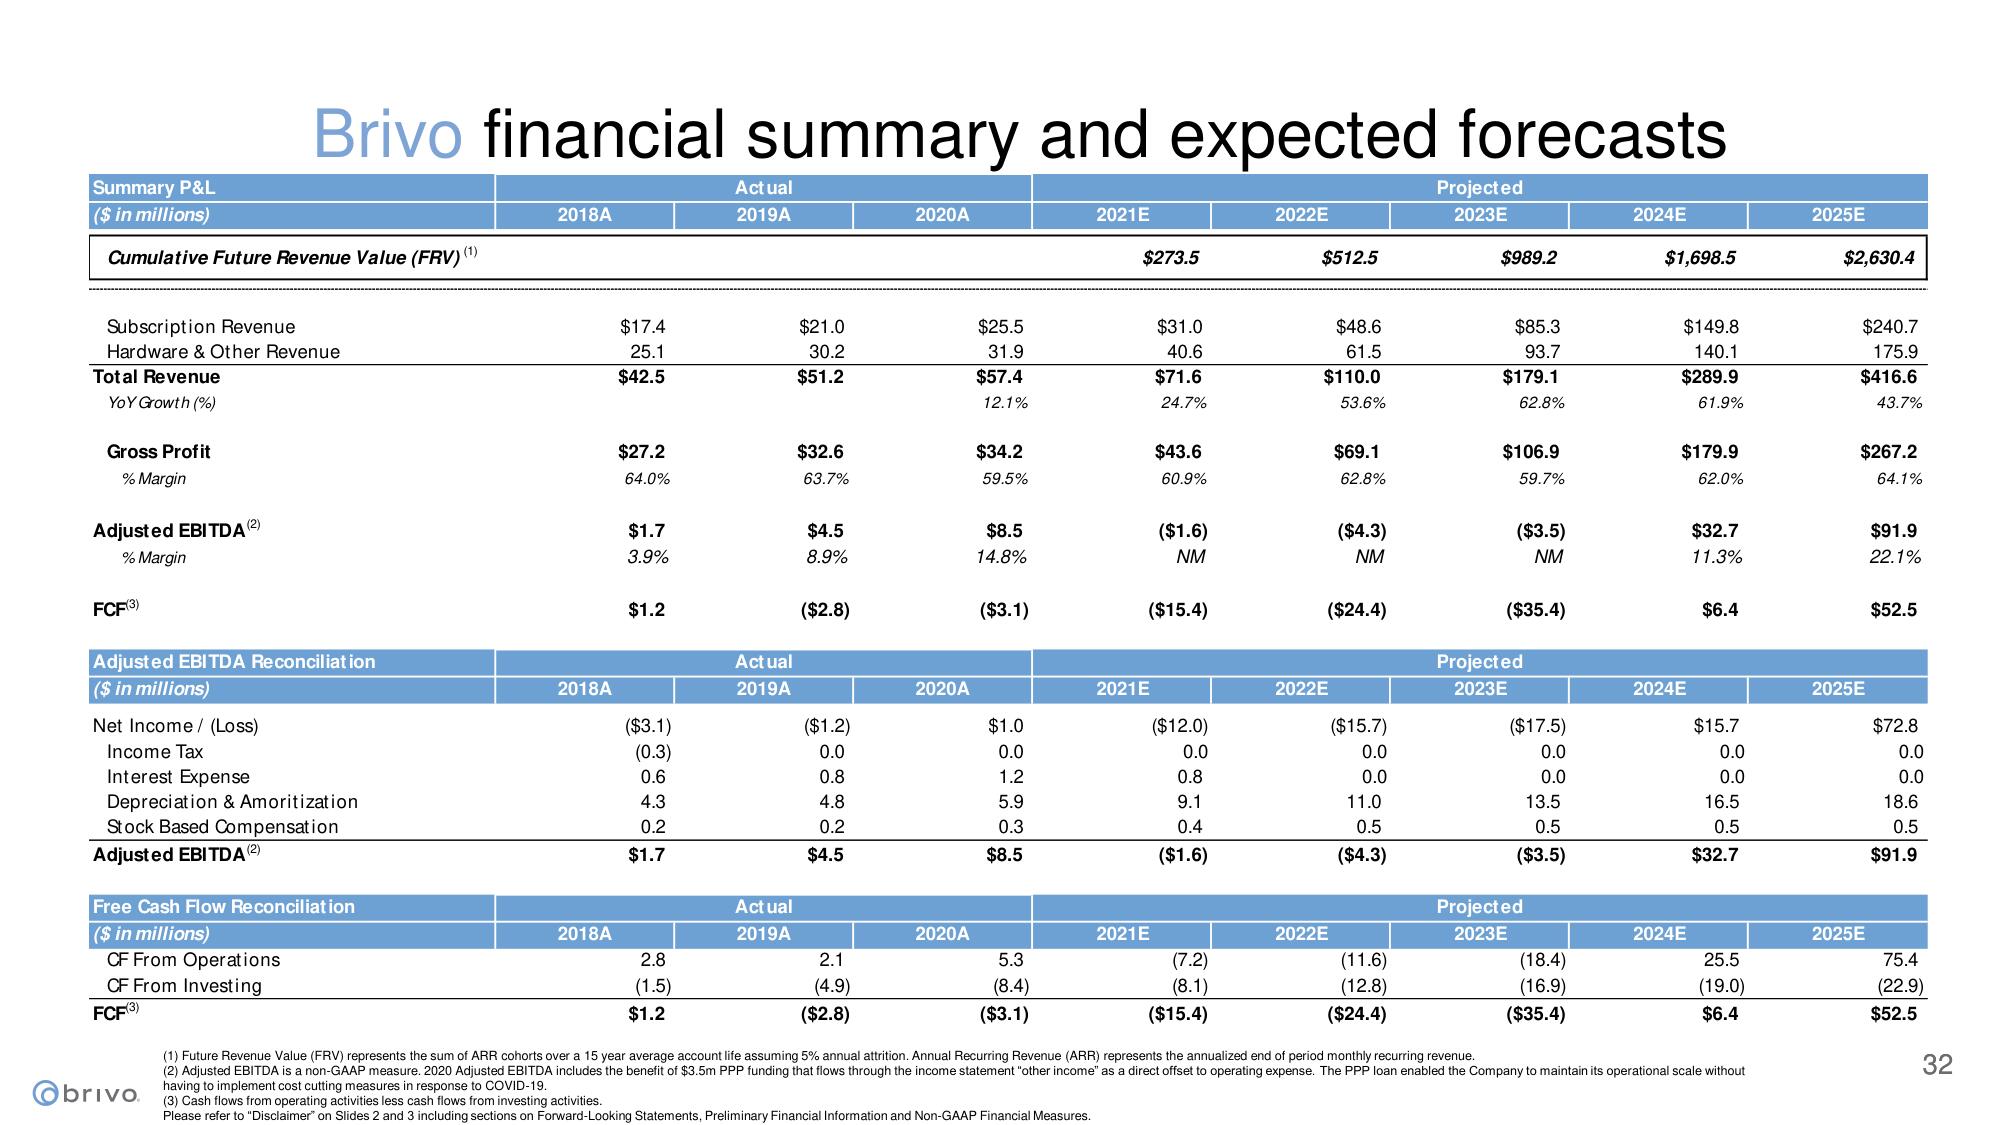
(1) Future Revenue Value (FRV) represents the sum f ARR cohorts over a 15 year average account life assuming 5% annual attrition. Annual Recurring Revenue (ARR) represents the annualized end of period monthly recurring revenue.
(2) Adjusted EBITDA is a non-GAAP measure. 2020 Adjusted EBITDA includes the benefit of $3.5m PPP funding that flows through the income statement "other income" as a direct offset to operating expense. The PPP loan enabled the Company to maintain its operational scale without
having to implement cost cutting measures in response to COVID-19.
(3) Cash flows from operating activities less cash flows from investing activities.
Please refer to "Disclaimer" on Slides 2 and 3 including sections on Forward-Looking Statements, Preliminary Financial Information and Non-GAAP Financial Measures.
2025E
$2,630.4
$240.7
175.9
$416.6
43.7%
$267.2
2025E
2025E
64.1%
$91.9
22.1%
$52.5
$72.8
0.0
0.0
18.6
0.5
$91.9
75.4
(22.9)
$52.5
32View entire presentation