CorpAcq SPAC Presentation Deck
35
3B
Market Leadership Analysis - Key Financial
Metrics
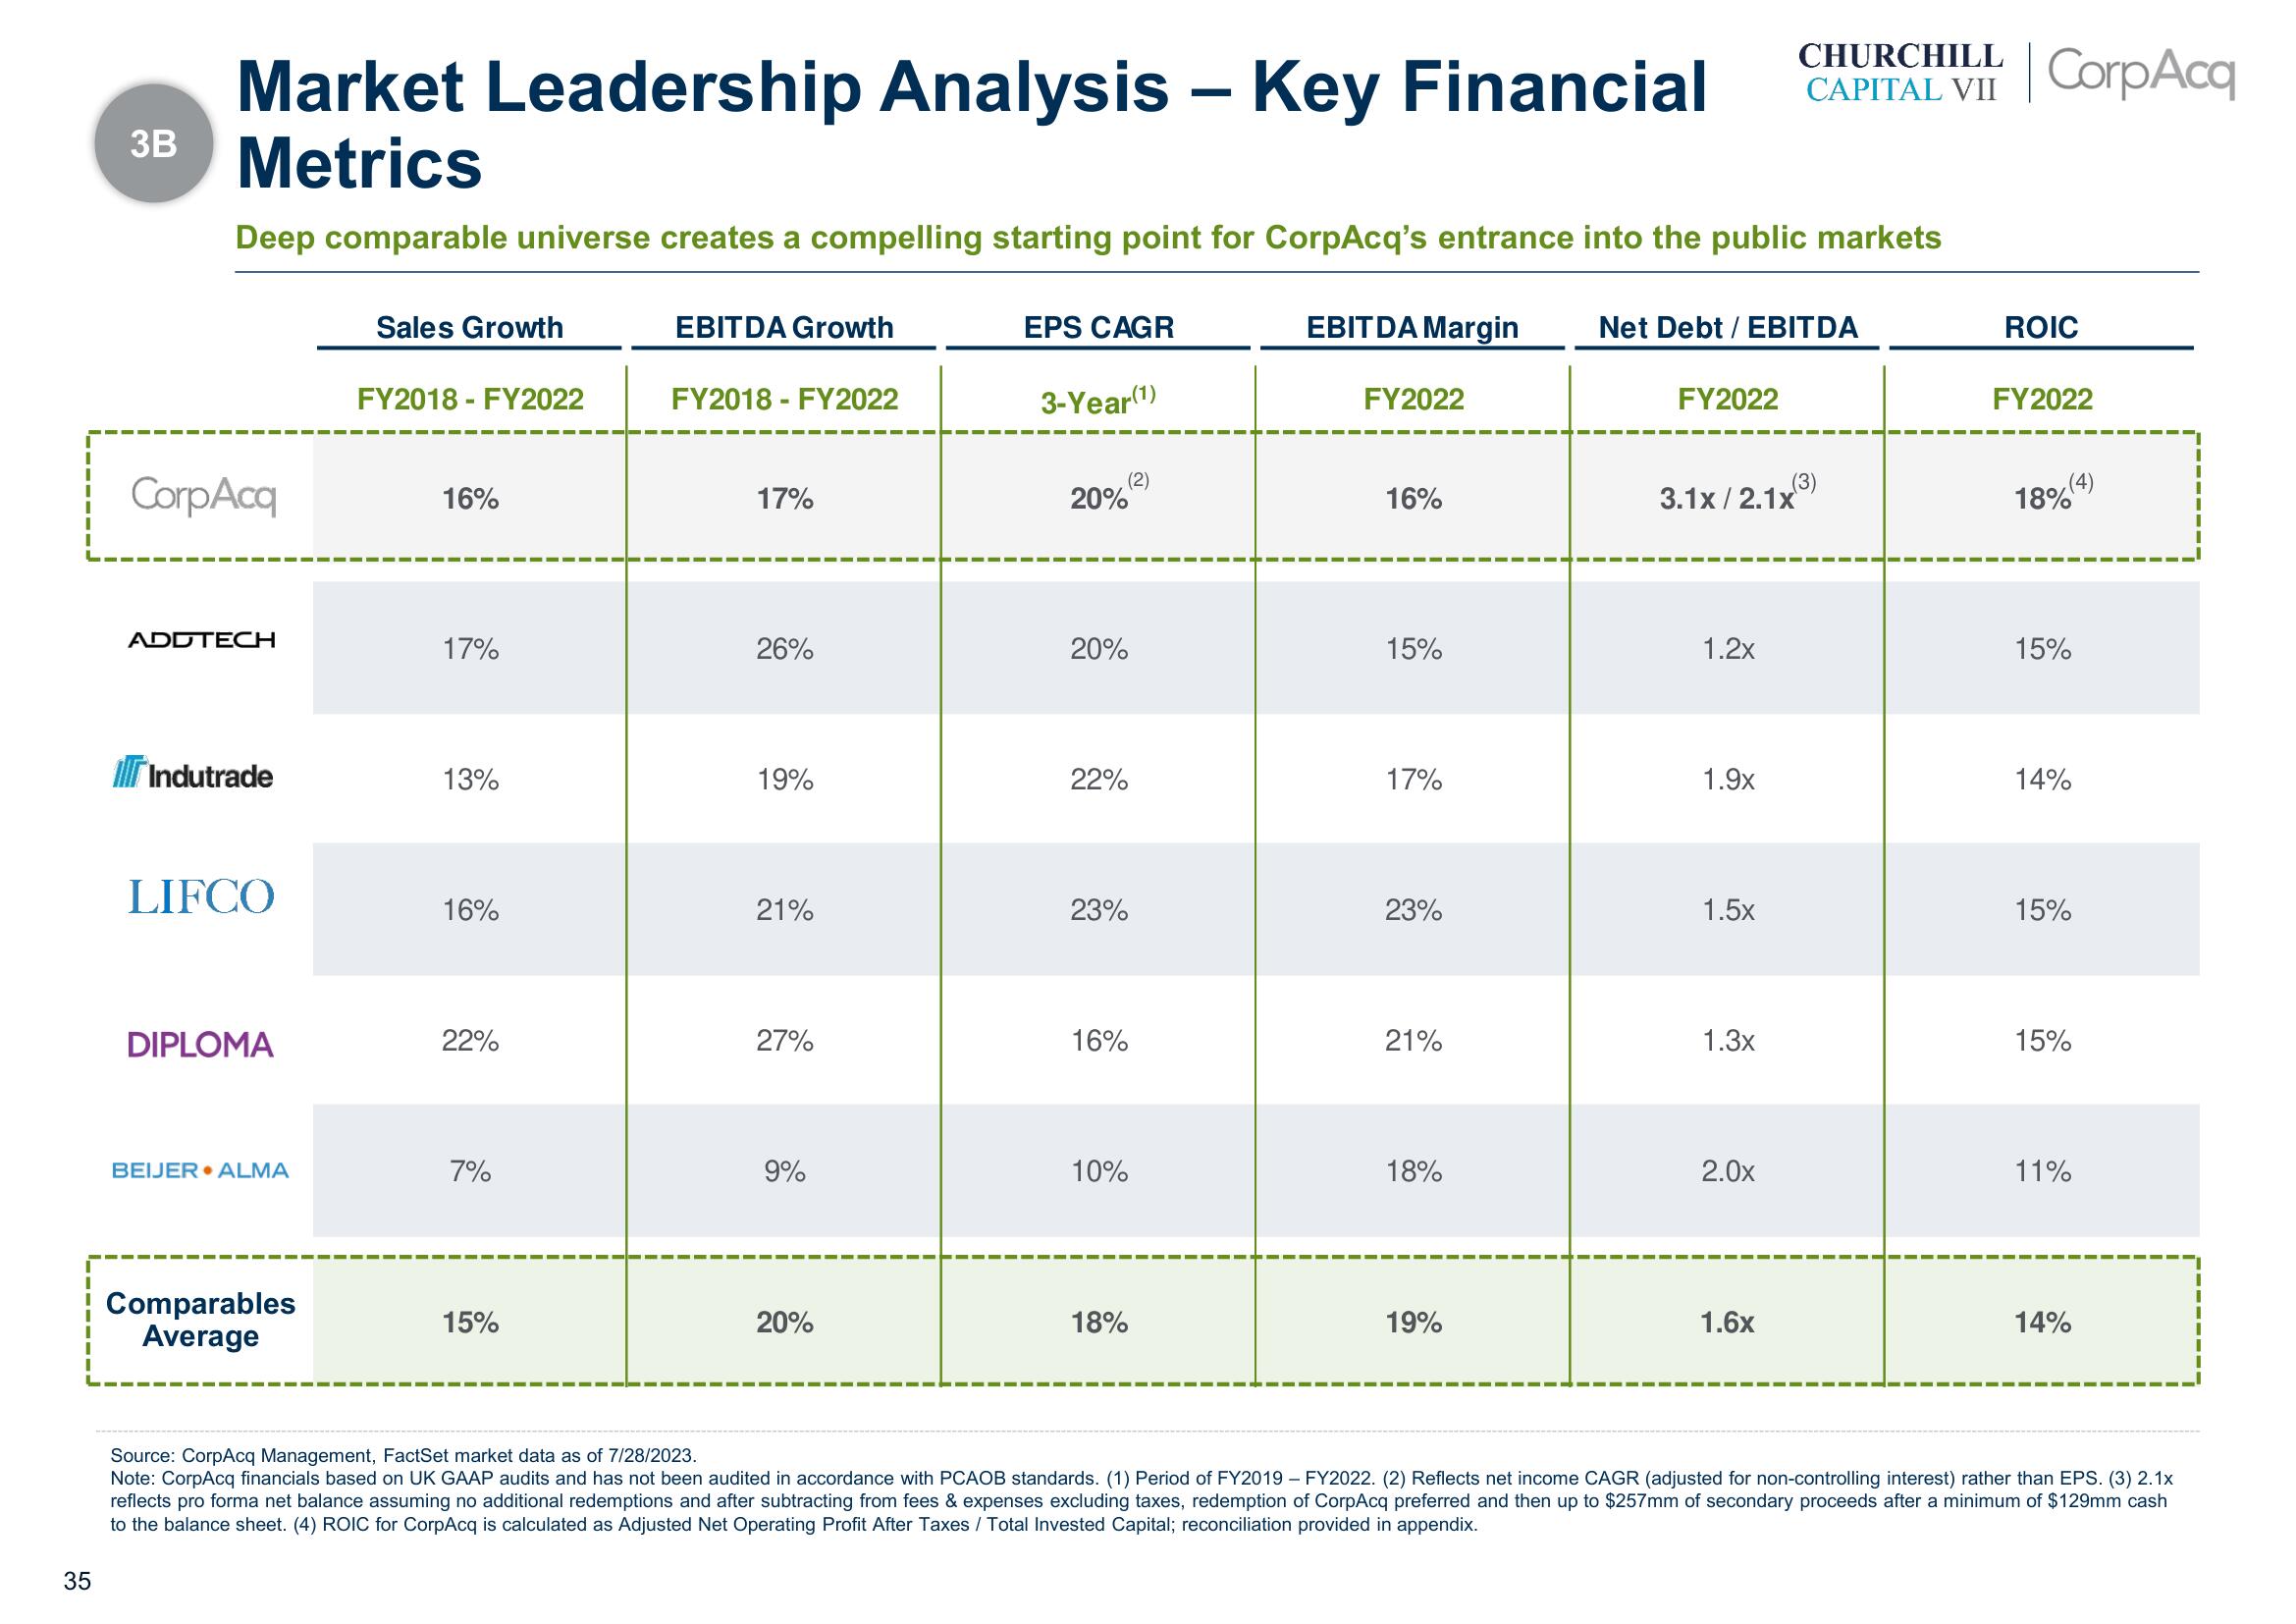
Deep comparable universe creates a compelling starting point for CorpAcq's entrance into the public markets
CorpAcq
ADDTECH
Indutrade
LIFCO
DIPLOMA
BEIJER• ALMA
Comparables
Average
Sales Growth
FY2018 - FY2022
16%
17%
13%
16%
22%
7%
15%
EBITDA Growth
FY2018 - FY2022
17%
26%
19%
21%
27%
9%
20%
EPS CAGR
3-Year(1)
20%
20%
22%
(2)
23%
16%
10%
18%
EBITDA Margin
FY2022
16%
15%
17%
23%
21%
18%
19%
Net Debt / EBITDA
FY2022
3.1x/2.1x
1.2x
1.9x
1.5x
1.3x
CHURCHILL
CAPITAL VII CorpAcq
2.0x
1.6x
(3)
ROIC
FY2022
18% (4)
15%
14%
15%
15%
11%
14%
Source: CorpAcq Management, FactSet market data as of 7/28/2023.
Note: CorpAcq financials based on UK GAAP audits and has not been audited in accordance with PCAOB standards. (1) Period of FY2019 - FY2022. (2) Reflects net income CAGR (adjusted for non-controlling interest) rather than EPS. (3) 2.1x
reflects pro forma net balance assuming no additional redemptions and after subtracting from fees & expenses excluding taxes, redemption of CorpAcq preferred and then up to $257mm of secondary proceeds after a minimum of $129mm cash
to the balance sheet. (4) ROIC for CorpAcq is calculated as Adjusted Net Operating Profit After Taxes / Total Invested Capital; reconciliation provided in appendix.View entire presentation