Presto SPAC Presentation Deck
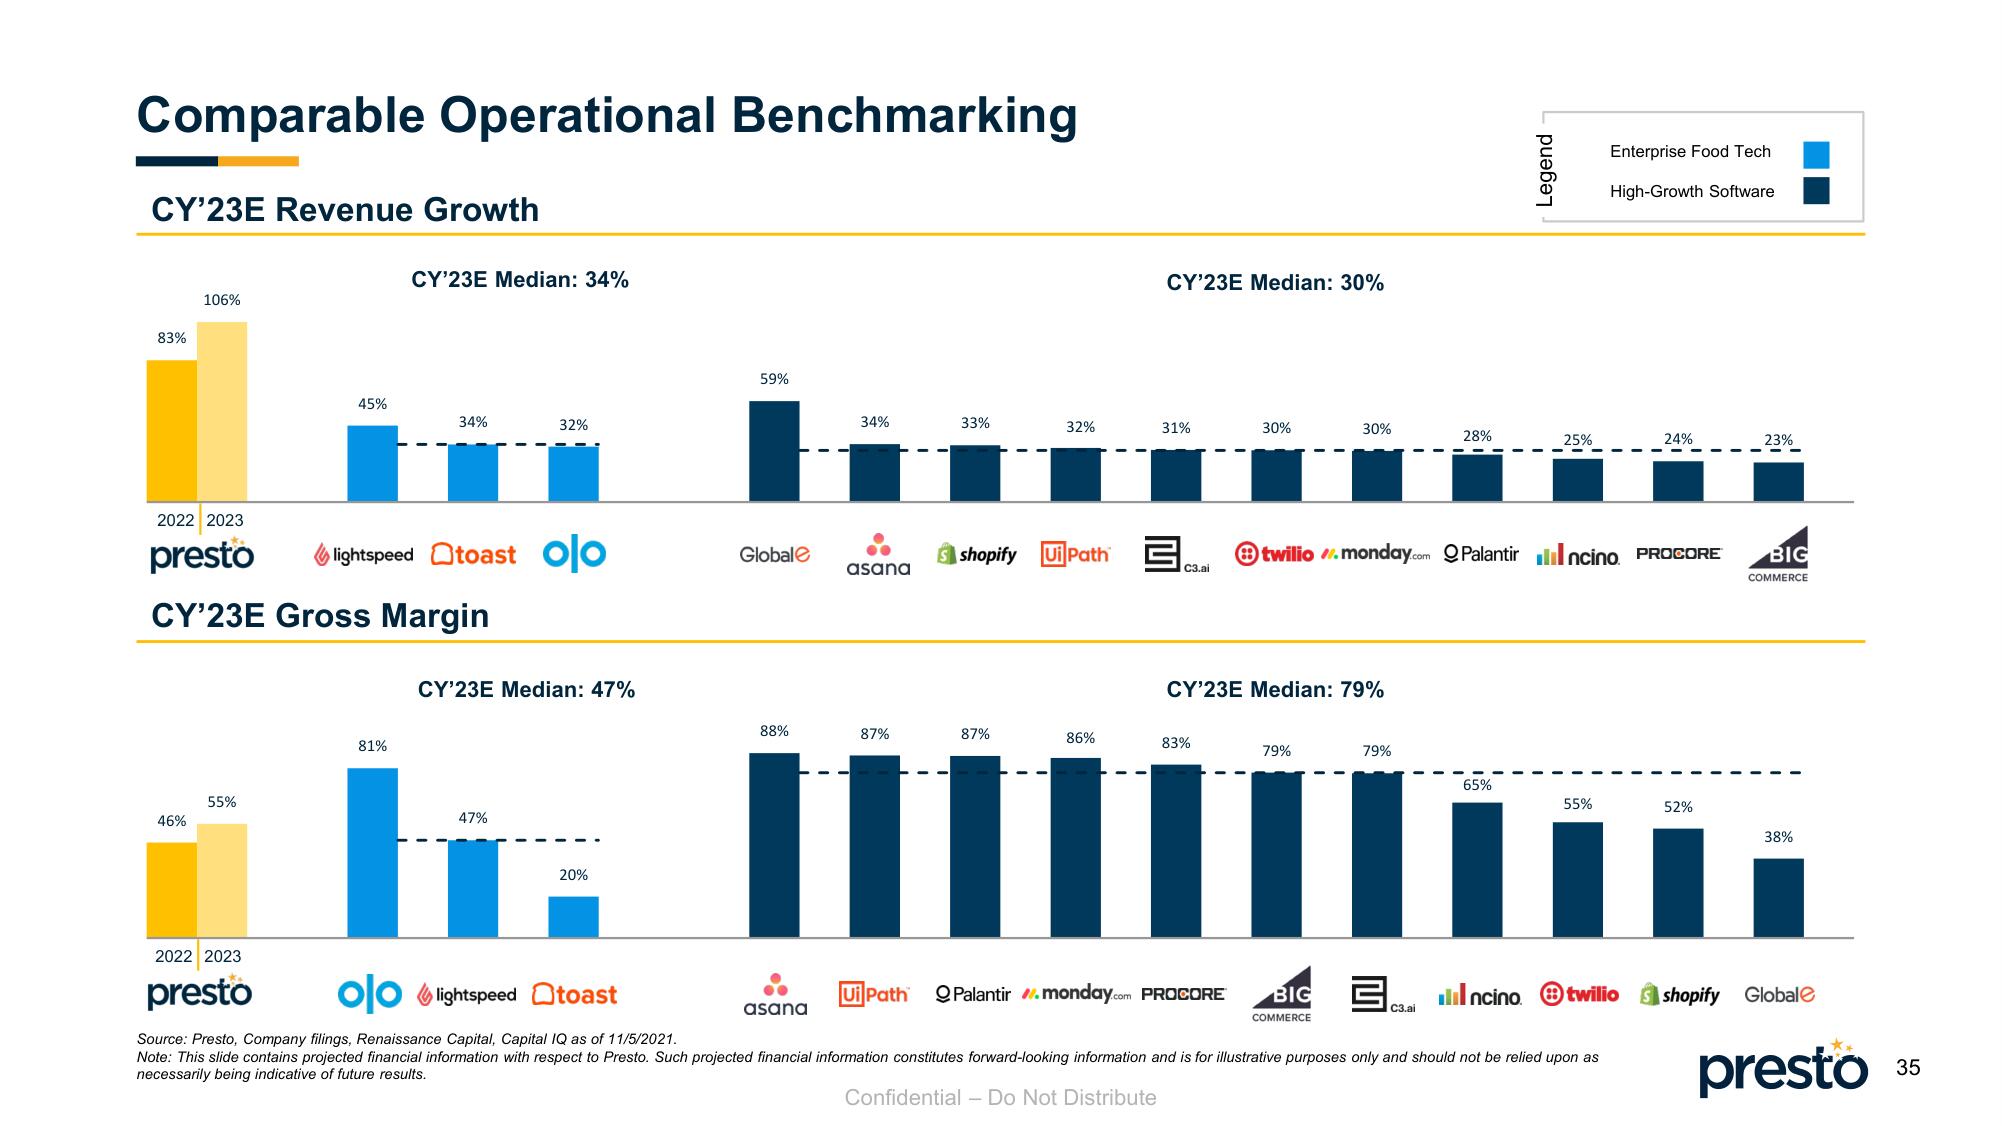
Comparable Operational Benchmarking
CY'23E Revenue Growth
83%
106%
46%
45%
55%
2022 2023
presto
CY'23E Gross Margin
CY'23E Median: 34%
34%
81%
lightspeed toast olo
32%
CY'23E Median: 47%
47%
20%
59%
Global
88%
34%
asana
asana
87%
33%
32%
87%
CY'23E Median: 30%
shopify UiPath cl
86%
31%
83%
30%
CY'23E Median: 79%
Ui Path Palantir monday.com PROCORE
30%
79%
BIG
COMMERCE
79%
28%
twilio //.monday.com Palantirncino. PROCORE
C3.ai
Legend
65%
2022 2023
presto
olo lightspeed toast
Source: Presto, Company filings, Renaissance Capital, Capital IQ as of 11/5/2021.
Note: This slide contains projected financial information with respect to Presto. Such projected financial information constitutes forward-looking information and is for illustrative purposes only and should not be relied upon as
necessarily being indicative of future results.
Confidential - Do Not Distribute
25%
55%
Enterprise Food Tech
High-Growth Software
24%
52%
23%
BIG
COMMERCE
38%
ilincino. twilioshopify Global
presto
35View entire presentation