Credit Suisse Investment Banking Pitch Book
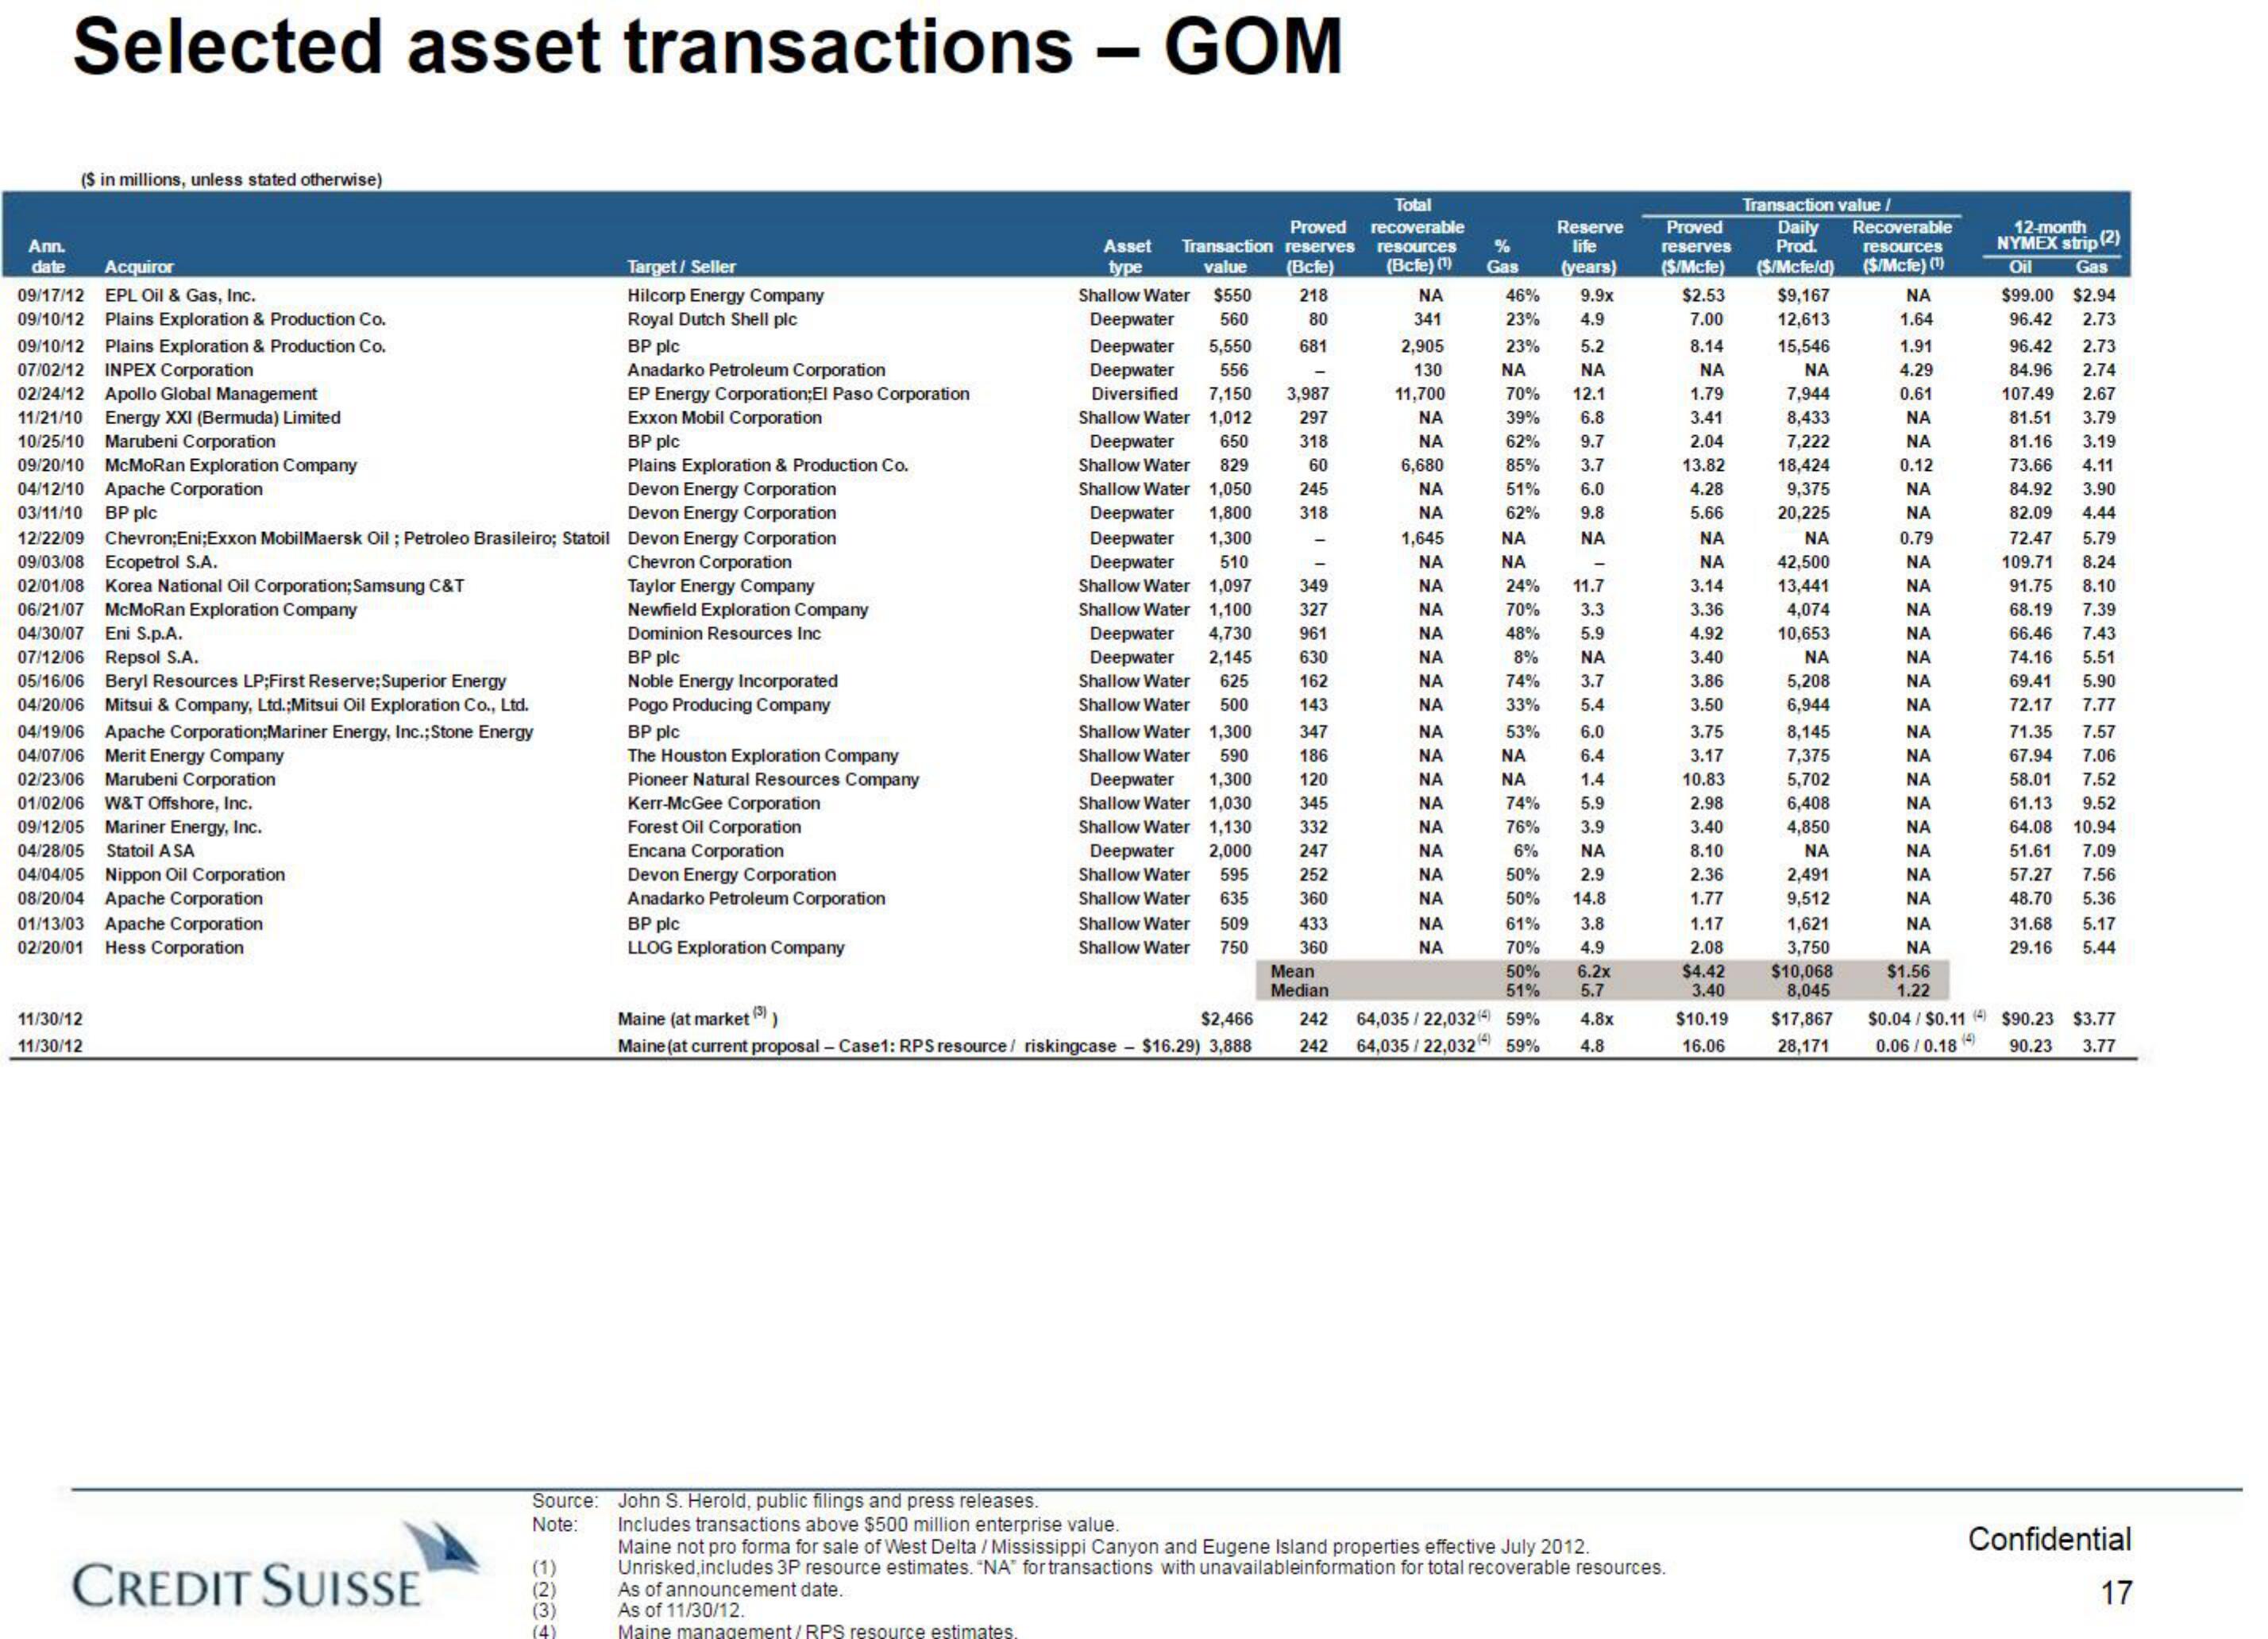
Selected asset transactions - GOM
($ in millions, unless stated otherwise)
Ann.
date Acquiror
09/17/12 EPL Oil & Gas, Inc.
09/10/12 Plains Exploration & Production Co.
09/10/12 Plains Exploration & Production Co.
07/02/12 INPEX Corporation
02/24/12 Apollo Global Management
11/21/10 Energy XXI (Bermuda) Limited
10/25/10 Marubeni Corporation
09/20/10 McMoRan Exploration Company
04/12/10 Apache Corporation
03/11/10 BP plc
02/01/08 Korea National Oil Corporation; Samsung C&T
06/21/07 McMoRan Exploration Company
04/30/07
Eni S.p.A.
12/22/09 Chevron;Eni;Exxon MobilMaersk Oil; Petroleo Brasileiro; Statoil Devon Energy Corporation
09/03/08 Ecopetrol S.A.
Chevron Corporation
07/12/06 Repsol S.A.
05/16/06 Beryl Resources LP;First Reserve; Superior Energy
04/20/06 Mitsui & Company, Ltd.;Mitsui Oil Exploration Co., Ltd.
04/19/06 Apache Corporation;Mariner Energy, Inc.; Stone Energy
04/07/06 Merit Energy Company
02/23/06 Marubeni Corporation
01/02/06 W&T Offshore, Inc.
09/12/05 Mariner Energy, Inc.
Statoil A SA
04/28/05
04/04/05 Nippon Oil Corporation
08/20/04 Apache Corporation
01/13/03 Apache Corporation
02/20/01 Hess Corporation
11/30/12
11/30/12
CREDIT SUISSE
Target/ Seller
Hilcorp Energy Company
Royal Dutch Shell plc
BP pic
Anadarko Petroleum Corporation
EP Energy Corporation;El Paso Corporation
Exxon Mobil Corporation
BP plc
Plains Exploration & Production Co.
Devon Energy Corporation
Devon Energy Corporation
(1)
(2)
(3)
(4)
Taylor Energy Company
Newfield Exploration Company
Dominion Resources Inc
BP plc
Noble Energy Incorporated
Pogo Producing Company
BP pic
The Houston Exploration Company
Pioneer Natural Resources Company
Kerr-McGee Corporation
Forest Oil Corporation
Encana Corporation
Devon Energy Corporation
Anadarko Petroleum Corporation
BP pic
LLOG Exploration Company
Source: John S. Herold, public filings and press releases.
Note:
Proved
Asset Transaction reserves
type
value (Bcfe)
Shallow Water $550
Deepwater
218
80
681
560
Deepwater 5,550
Deepwater 556
Diversified 7,150 3,987
Shallow Water 1,012
297
Deepwater 650 318
Shallow Water 829
60
Shallow Water 1,050 245
Deepwater 1,800 318
Deepwater 1,300
Deepwater 510
Shallow Water 1,097
Shallow Water 1,100
Deepwater 4,730
Deepwater 2,145
Shallow Water 625
Shallow Water 500
Shallow Water 1,300
Shallow Water 590
Deepwater 1,300
Shallow Water 1,030
Shallow Water 1,130
Deepwater 2,000
Shallow Water
Shallow Water
Shallow Water
595
635
509
Shallow Water 750
349
327
961
630
162
143
Includes transactions above $500 million enterprise value.
347
186
120
345
332
247
252
360
433
360
Mean
Median
Total
recoverable
resources %
(Bcfe) (1)
Gas
ΝΑ
46%
23%
23%
ΝΑ
341
2,905
130
11,700
ΝΑ
ΝΑ
6,680
ΝΑ
ΝΑ
1,645
ΝΑ
ΝΑ
ΝΑ
ΝΑ
ΝΑ
ΝΑ
ΝΑ
ΝΑ
ΝΑ
ΝΑ
ΝΑ
ΝΑ
ΝΑ
ΝΑ
ΝΑ
ΝΑ
ΝΑ
70% 12.1
39% 6.8
62% 9.7
85% 3.7
51% 6.0
62% 9.8
ΝΑ
NA
ΝΑ
53%
ΝΑ
ΝΑ
24%
11.7
70% 3.3
48%
5.9
8% ΝΑ
74%
3.7
5.4
33%
74%
76%
6%
50%
50%
61%
70%
Maine (at market (3) ')
$2,466
242 64,035/22,032 (4) 59%
Maine (at current proposal - Case1: RPS resource/ riskingcase $16.29) 3,888 242 64,035/22,032) 59%
Proved
reserves
Reserve
life
(years) ($/Mcfe)
9.9x
$2.53
4.9
7.00
5.2
8.14
ΝΑ
ΝΑ
1.79
3.41
2.04
13.82
4.28
5.66
ΝΑ
ΝΑ
3.14
50%
51%
-
6.0
6.4
1.4
5.9
3.9
ΝΑ
2.9
14.8
3.8
4.9
6.2x
5.7
4.8x
4.8
Maine not pro forma for sale of West Delta / Mississippi Canyon and Eugene Island properties effective July 2012.
Unrisked, includes 3P resource estimates. "NA" for transactions with unavailableinformation for total recoverable resources.
As of announcement date.
As of 11/30/12.
Maine management/RPS resource estimates.
3.36
4.92
3.40
3.86
3.50
3.75
3.17
10.83
2.98
3.40
8.10
2.36
1.77
1.17
2.08
$4.42
3.40
$10.19
16.06
Transaction value /
Daily Recoverable
Prod.
resources
($/Mcfe/d)
$9,167
12,613
15,546
ΝΑ
7,944
8,433
7,222
18,424
9,375
20,225
ΝΑ
42,500
13,441
4,074
10,653
($/Mcfe) (¹)
ΝΑ
1.64
1.91
4.29
0.61
ΝΑ
ΝΑ
0.12
ΝΑ
ΝΑ
0.79
ΝΑ
ΝΑ
ΝΑ
ΝΑ
ΝΑ
ΝΑ
ΝΑ
ΝΑ
ΝΑ
ΝΑ
ΝΑ
ΝΑ
ΝΑ
ΝΑ
ΝΑ
1,621
3,750
$10,068
ΝΑ
ΝΑ
$1.56
8,045
1.22
$17,867 $0.04/$0.11 (4) $90.23 $3.77
28,171
0.06/0.18 (4)
90.23 3.77
ΝΑ
5,208
6,944
8,145
7,375
5,702
6,408
4,850
ΝΑ
2,491
9,512
12-month
NYMEX strip (2)
Oil Gas
$99.00 $2.94
96.42
2.73
96.42
2.73
84.96 2.74
107.49 2.67
3.79
3.19
4.11
81.51
81.16
73.66
84.92 3.90
82.09 4.44
72.47 5.79
109.71 8.24
91.75 8.10
68.19 7.39
7.43
66.46
74.16 5.51
5.90
69.41
7.77
72.17
71.35
7.57
67.94 7.06
58.01 7.52
61.13
9.52
64.08 10.94
51.61 7.09
57.27 7.56
48.70 5.36
31.68 5.17
29.16 5.44
Confidential
17View entire presentation